An analysis of AI financing activity, April 2025 – April 2026
Between April 2025 and April 2026, 8,202 financing events were announced across 7,118 AI companies in 90+ countries. The disclosed total: $431.8 billion. That number is real, but almost nothing about it means what it appears to.
Nearly a third of it — $131 billion — is not venture capital at all. It is debt facilities for data centers, secondary sales to existing shareholders, strategic investments, and public-market transactions, all wearing the same "AI funding" label. The instruments look identical in a spreadsheet. They represent fundamentally different economic events.
Of the capital that did move as equity, three-quarters flowed to fewer than 360 companies building foundation models and compute infrastructure. The 4,000+ application companies that make up two-thirds of the ecosystem — the ones building AI into healthcare, legal, finance, and hundreds of other domains — collectively received 12% of disclosed dollars. A typical compute company raised 19 times more per round than a typical vertical application startup.
The market's maturity tells an unexpected story too. Most companies are young — 61% of all rounds are seed or pre-seed. But the largest capital events resist stage labels entirely, operating in financing structures the venture ladder was never built to describe. And when companies raise again within the year, 70% stay at the same stage. The dominant pattern is not graduation. It is repetition.
Geography looks global until you follow the money. The Bay Area — 39% of U.S. AI companies — captured 77% of U.S. disclosed dollars. Ireland appeared to be one of Europe's most capital-rich AI markets. In reality, a single company accounts for 99% of its disclosed total.
Most striking: the concentration story, the infrastructure story, the repeat-fundraising story, and the geography story turned out to be the same story. The same 15–20 companies appear at the top of every list this report constructed. Remove them and the headline total drops by more than half. The broad ecosystem of 7,000+ early-stage companies barely notices.
What follows is an attempt to take that apart.
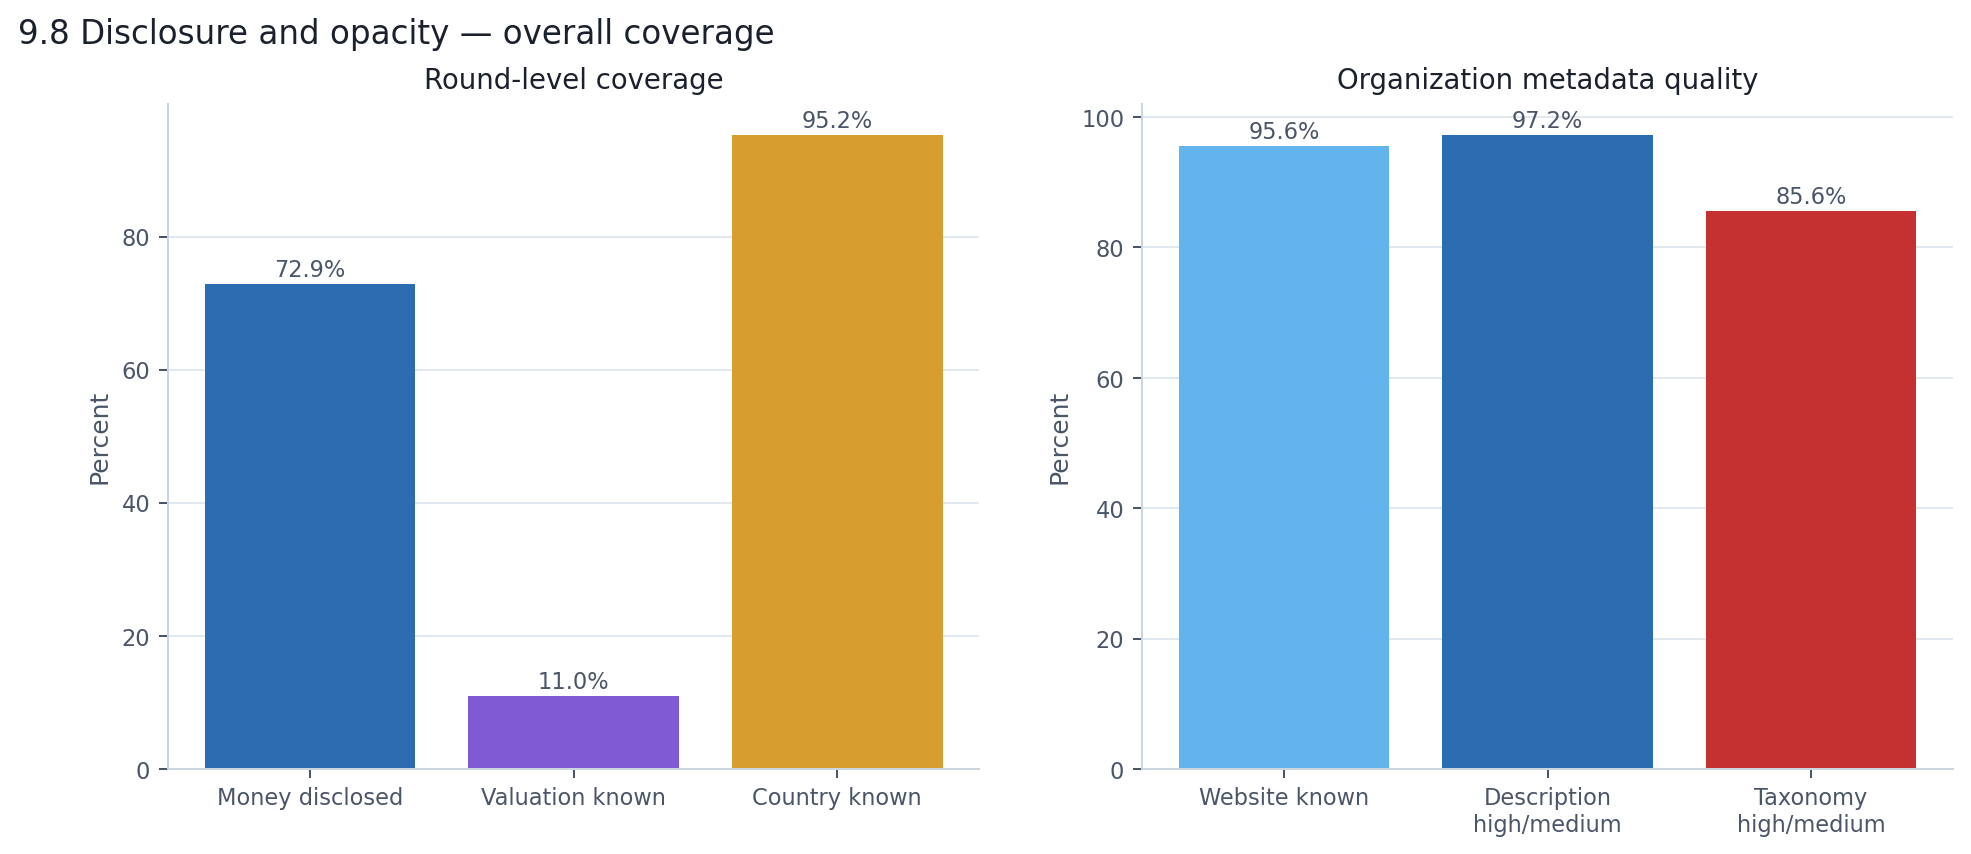
This report draws on 8,202 announced financing events across 7,118 AI companies, tracked between April 2025 and April 2026. The dataset spans venture equity, debt facilities, government grants, public-market transactions, and secondary sales — 73% of rounds disclose a raised amount, 11% disclose a pre-money valuation, and headquarters country is known for 95%. Dollar totals are disclosed lower bounds; the actual figure is higher and unknowable from this data alone.
| What we know | Coverage |
|---|---|
| Financing events tracked | 8,202 |
| Unique organizations | 7,118 |
| Window | April 2025 – April 2026 |
| Round amount disclosed | 72.9% |
| Pre-money valuation disclosed | 11.0% |
| HQ country known | 95.2% |
The headline number is $431.8 billion in disclosed financing across 8,202 announced rounds. The number that actually matters is $2 million — the median round size. Those two figures, sitting side by side, tell you almost everything you need to know about this market before you read another page.
| Announced financing events | 8,202 |
| Unique organizations | 7,118 |
| Disclosed dollar lower bound | $431.8B |
| Median disclosed round | $2.0M |
| 75th percentile round | $9.7M |
| 90th percentile round | $35.0M |
Most of these 8,202 rounds were small. Nearly half of all disclosed rounds came in under $5 million. Seed and pre-seed rounds alone made up 61% of all announcements. This is a market with thousands of companies raising modest amounts of money to build things.
And yet, 81 rounds of $500 million or more — exactly 1% of announcements — accounted for 81% of all disclosed dollars. Ten rounds accounted for 58%. The entire disclosed dollar total is, in practical terms, a story about a few dozen very large checks written to a very small number of companies.
The easiest way to see this is to look at what happened month by month.
Round counts were remarkably stable. Every full month landed between 607 and 813 announcements. No boom month, no dead month. The AI financing ecosystem was active and consistent throughout the year.
Disclosed dollars were the opposite — wildly volatile. February 2026 alone contributed $177 billion, roughly 41% of the entire year's disclosed total. Remove mega rounds, though, and the volatility disappears. The non-mega market ran at a steady $2.6–4.1 billion per month.
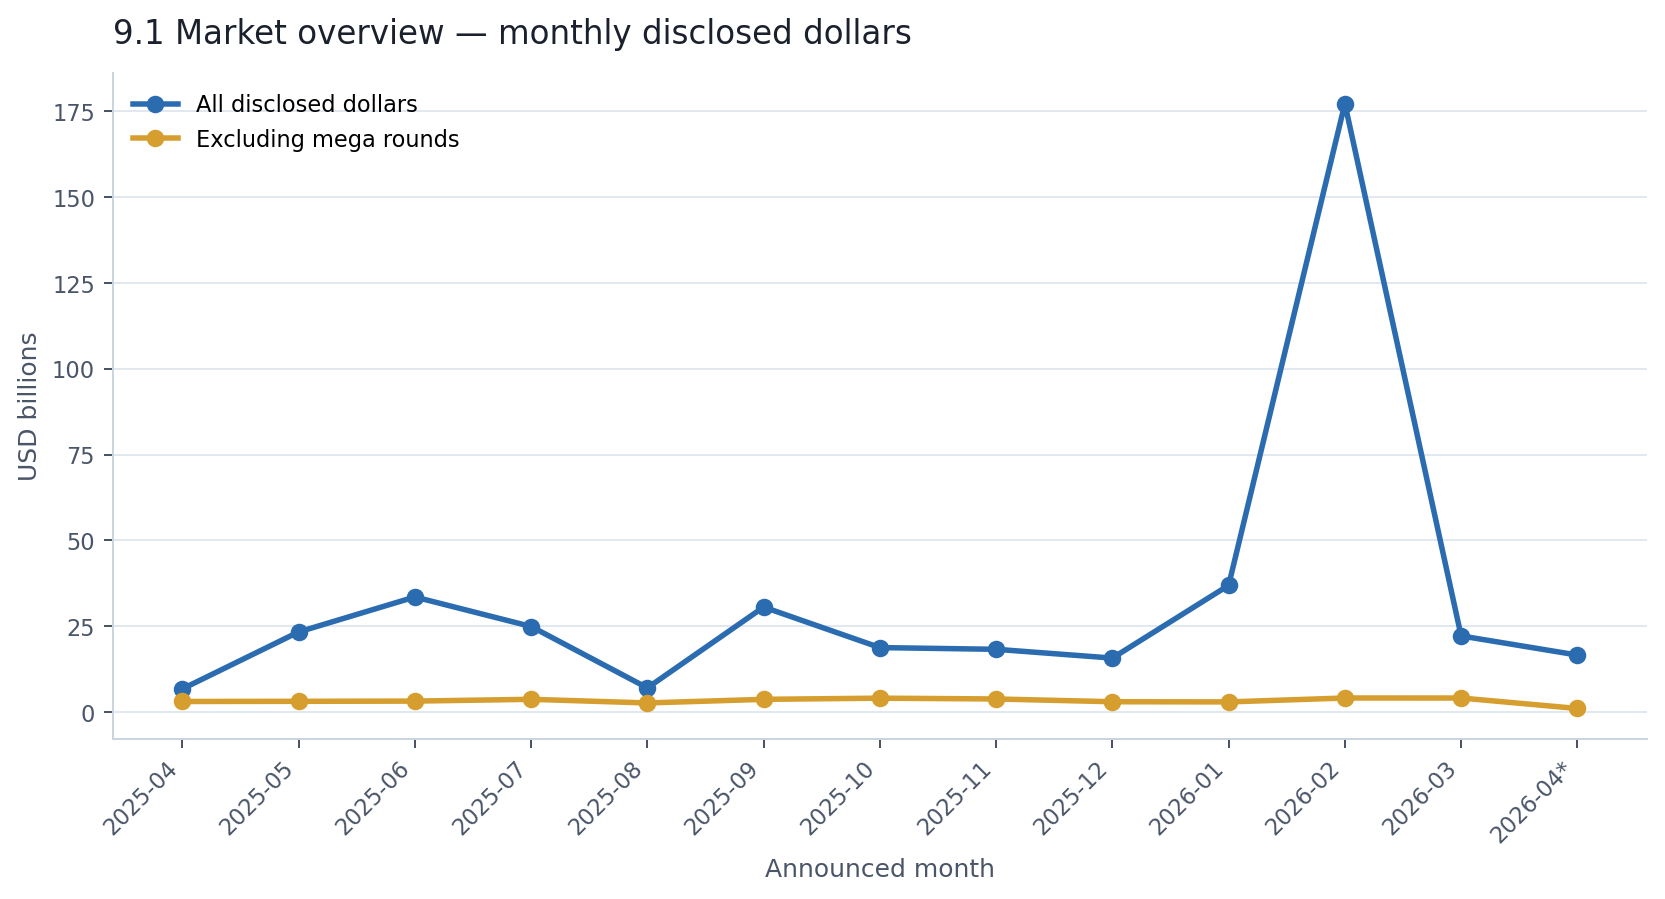
That gap between the two lines is the central tension of this entire report. There is a broad, steady, seed-heavy AI financing ecosystem — and then there is a small, volatile, mega-round-driven capital layer sitting on top of it. They show up in the same dataset, but they are essentially different markets.
The split shows up just as clearly when you look at stage.
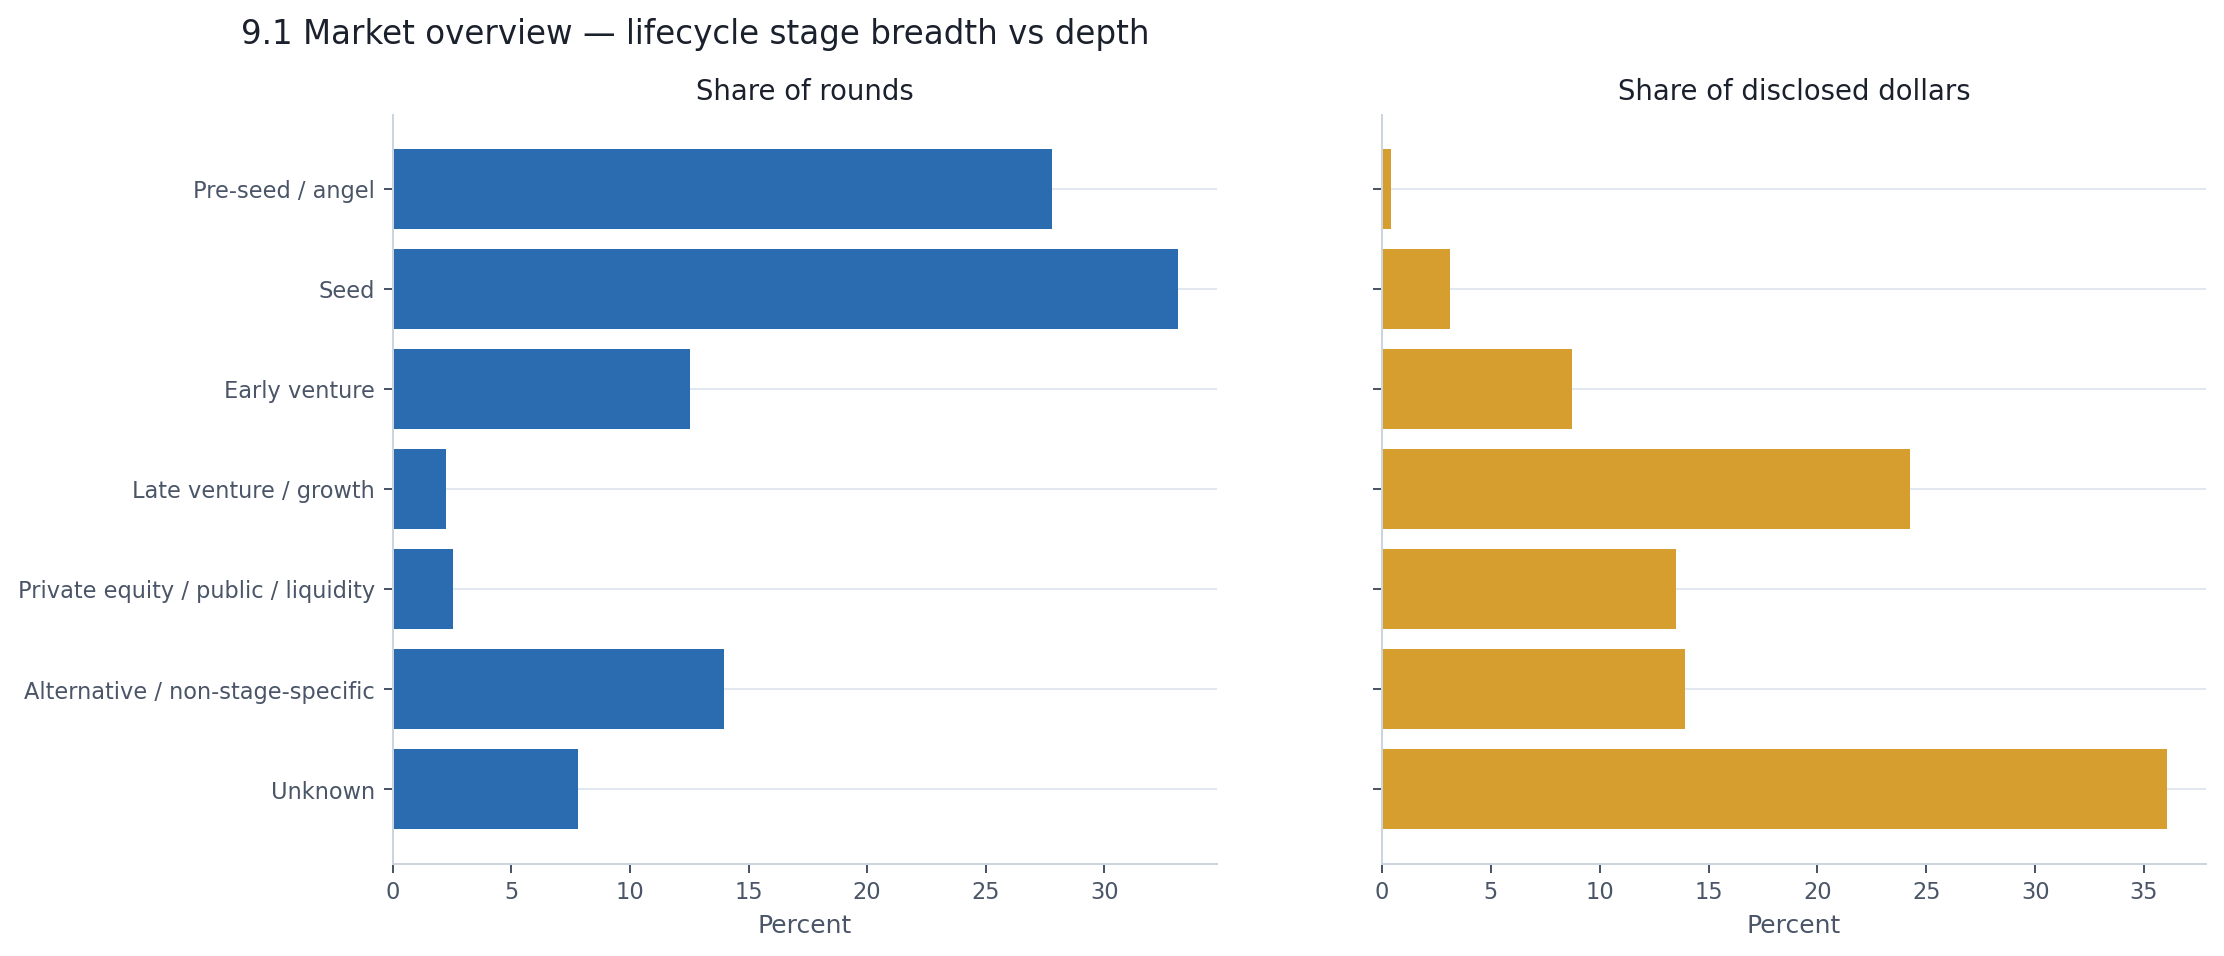
Pre-seed and seed rounds make up 61% of all announcements but account for just 3.5% of disclosed dollars. Late venture and growth rounds make up just 2.2% of announcements but capture 24% of disclosed dollars. And the single largest dollar bucket — 36% of all disclosed capital — sits in rounds with no clean stage label at all.
This is not a market where capital is gradually distributed across a healthy stage ladder. It is a market where the broad base and the capital peak are almost entirely disconnected.
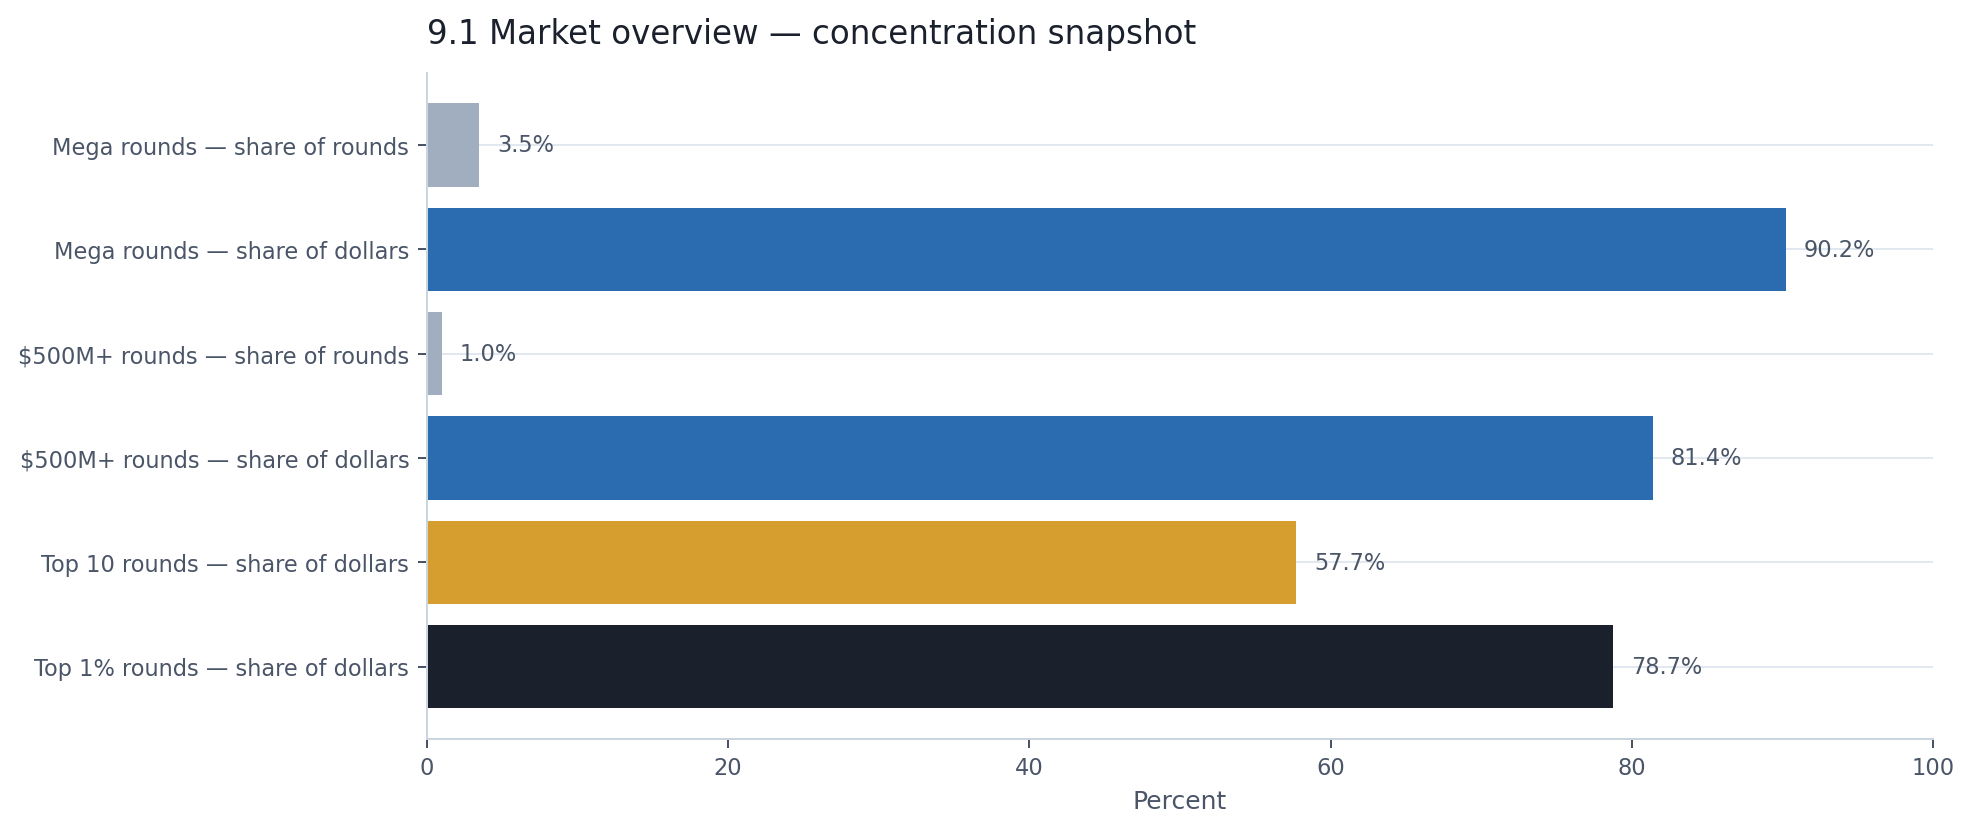
Mega rounds — 3.5% of announcements — hold 90.2% of disclosed dollars. That one number should anchor everything that follows. Every chapter in this report is, in some way, an attempt to explain what is inside that 90% and what is outside it.
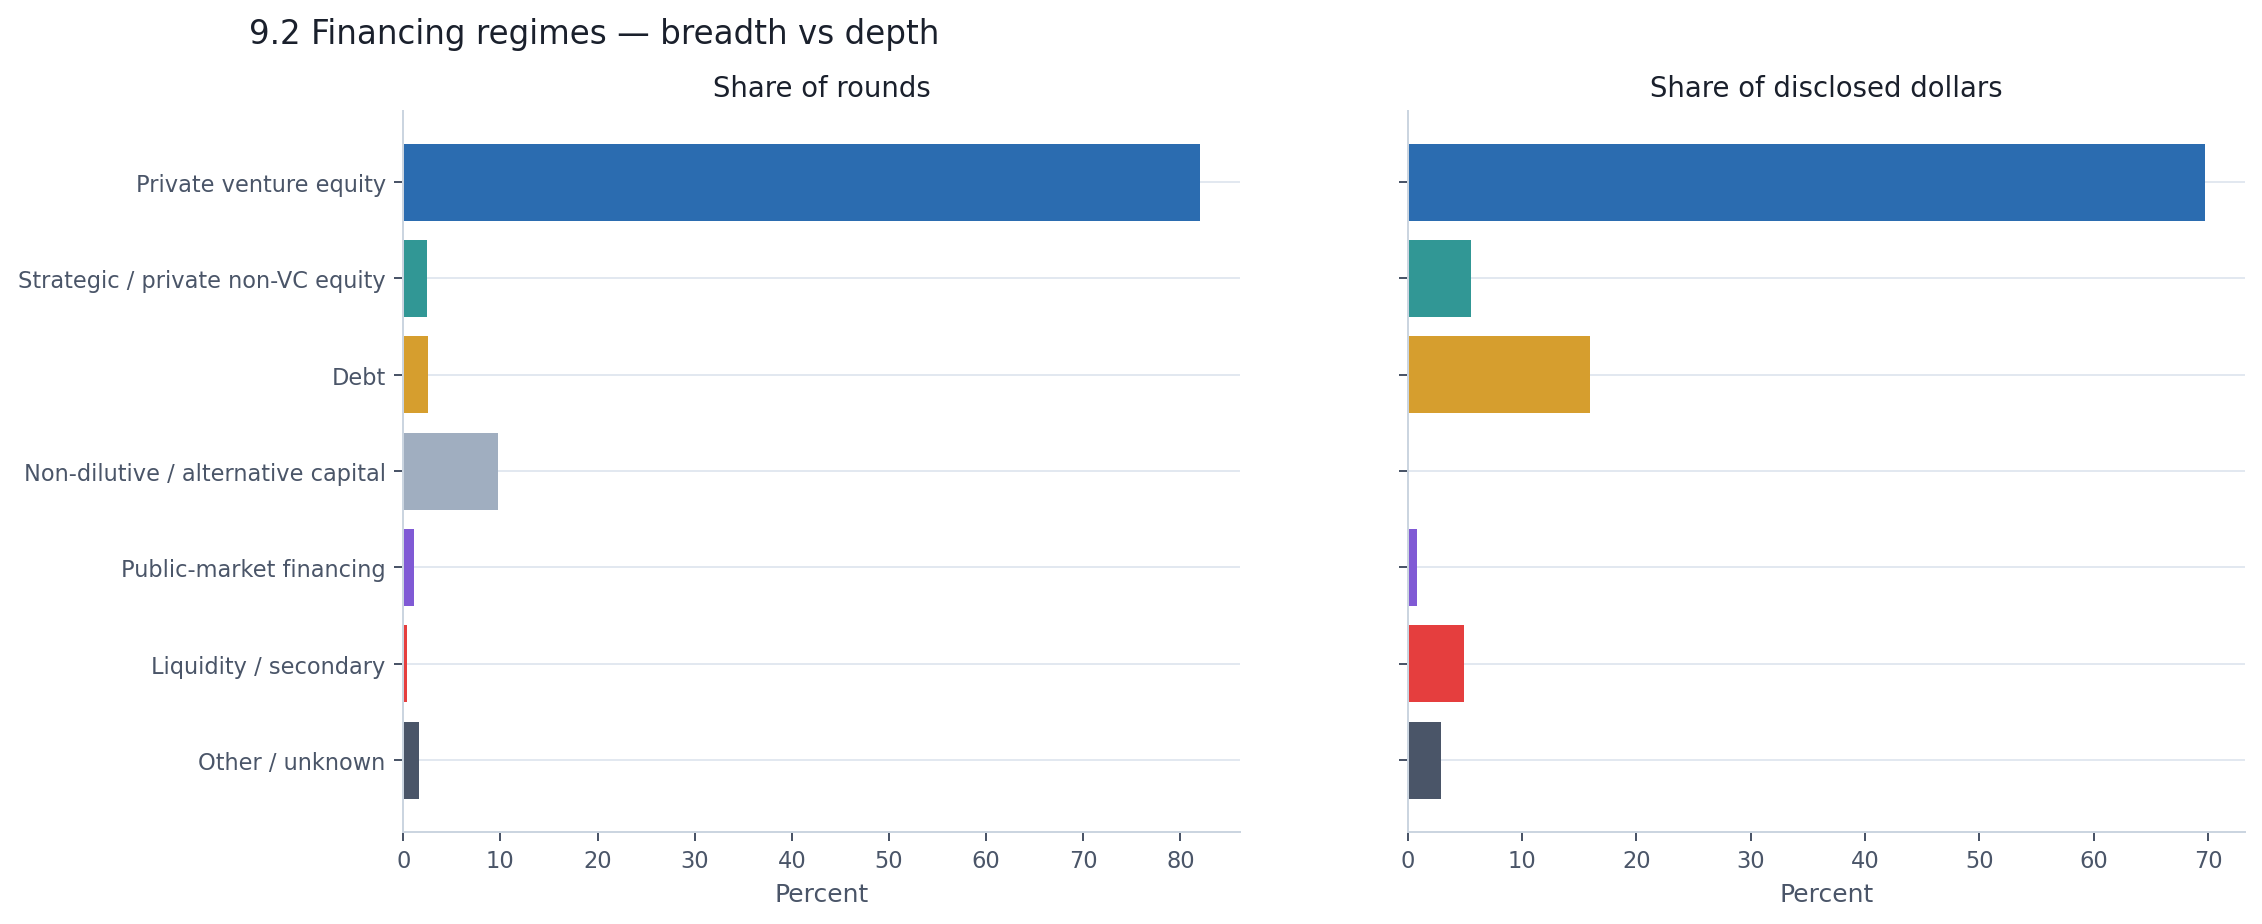
That $431.8 billion is not one kind of money. The dataset contains venture equity, debt facilities, government grants, public-market offerings, corporate rounds, and secondary transactions — instruments that look identical in a spreadsheet row but represent fundamentally different economic events.
| Financing regime | % of rounds | Disclosed $ | % of disclosed $ |
|---|---|---|---|
| Private venture equity | 82.1% | $301.1B | 69.7% |
| Debt | 2.6% | $69.0B | 16.0% |
| Strategic / private non-VC equity | 2.5% | $23.9B | 5.5% |
| Liquidity / secondary | 0.4% | $21.2B | 4.9% |
| Non-dilutive / alternative capital | 9.8% | $0.4B | 0.08% |
| Public-market financing | 1.1% | $3.7B | 0.9% |
| Other / unknown | 1.7% | $12.5B | 2.9% |
Private venture equity makes up 82% of all announcements but only 70% of disclosed dollars. Roughly $131 billion — about 30% of the total — comes from something other than classic venture rounds.
Debt is the standout non-venture regime: just 2.6% of activity but $69 billion in disclosed capital — money for data centers and infrastructure, not early-stage product development. Liquidity and secondary transactions added $21.2 billion across only 30 rounds, but that money typically went to existing shareholders, not the company. Grants and non-dilutive capital account for nearly 10% of all announcements but just 0.08% of disclosed dollars — breadth without capital weight.
If you looked only at how many companies raised money, you would conclude that AI is an applications market. If you looked only at how much money was raised, you would conclude it is an infrastructure market. Both would be right. That is the single most important structural fact about AI financing today.
Every organization in the dataset was classified by its position in the AI stack — from low-level compute and foundation models up through developer tools and into horizontal and vertical applications. The chart below shows what each layer looks like by company count versus disclosed dollars.
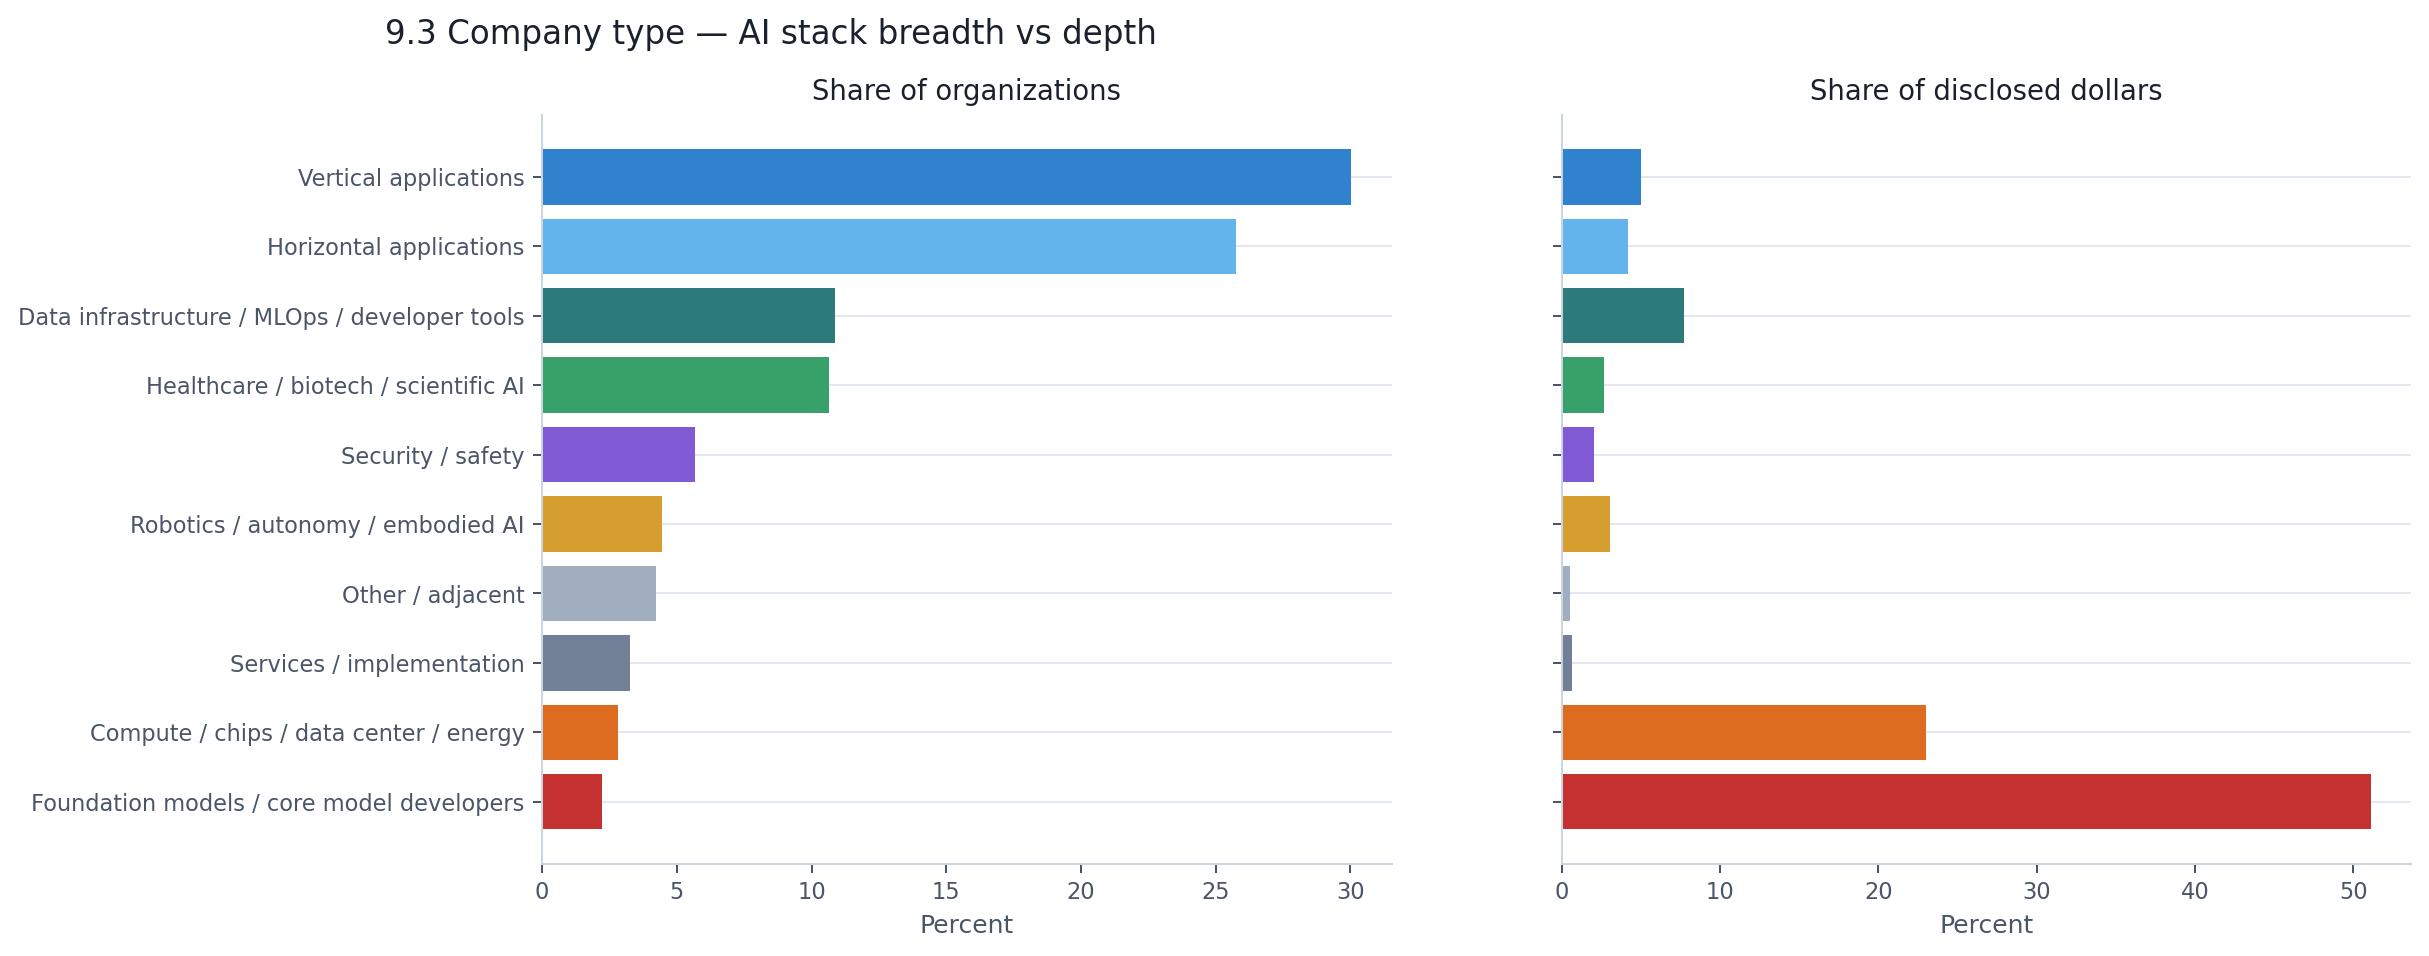
Vertical applications — companies building AI for healthcare workflows, legal research, financial compliance, and hundreds of other specific domains — represent 30% of all organizations. Add horizontal applications and the application layer accounts for two-thirds of the ecosystem by company count. This is a genuinely broad market. Thousands of teams are building AI products for real end users.
But those thousands of application companies collectively received 12% of disclosed dollars.
Meanwhile, foundation model developers — 158 companies, just 2.2% of the ecosystem — absorbed 51% of all disclosed capital. Compute and data center companies added another 23% on a similarly tiny organizational base. Two layers of the stack, representing fewer than 360 companies combined, captured three-quarters of all visible money.
| AI stack layer | Companies | % of companies | % of disclosed $ | Median round |
|---|---|---|---|---|
| Vertical applications | 2,138 | 30.0% | 5.0% | $1.4M |
| Horizontal applications | 1,834 | 25.8% | 4.2% | $1.4M |
| Data infra / MLOps / dev tools | 775 | 10.9% | 7.7% | $2.8M |
| Healthcare / biotech / scientific AI | 758 | 10.6% | 2.7% | $2.4M |
| Security / safety | 404 | 5.7% | 2.0% | $4.2M |
| Robotics / autonomy / embodied AI | 317 | 4.5% | 3.1% | $5.0M |
| Compute / chips / data center / energy | 201 | 2.8% | 23.0% | $26.5M |
| Foundation models / core model developers | 158 | 2.2% | 51.1% | $8.0M |
The median round sizes tell their own story. A typical vertical application company raised $1.4 million. A typical compute company raised $26.5 million — nearly 19 times more. These are not companies competing in the same economic league.
When you collapse the stack into two buckets — applications versus infrastructure — the asymmetry becomes impossible to miss.
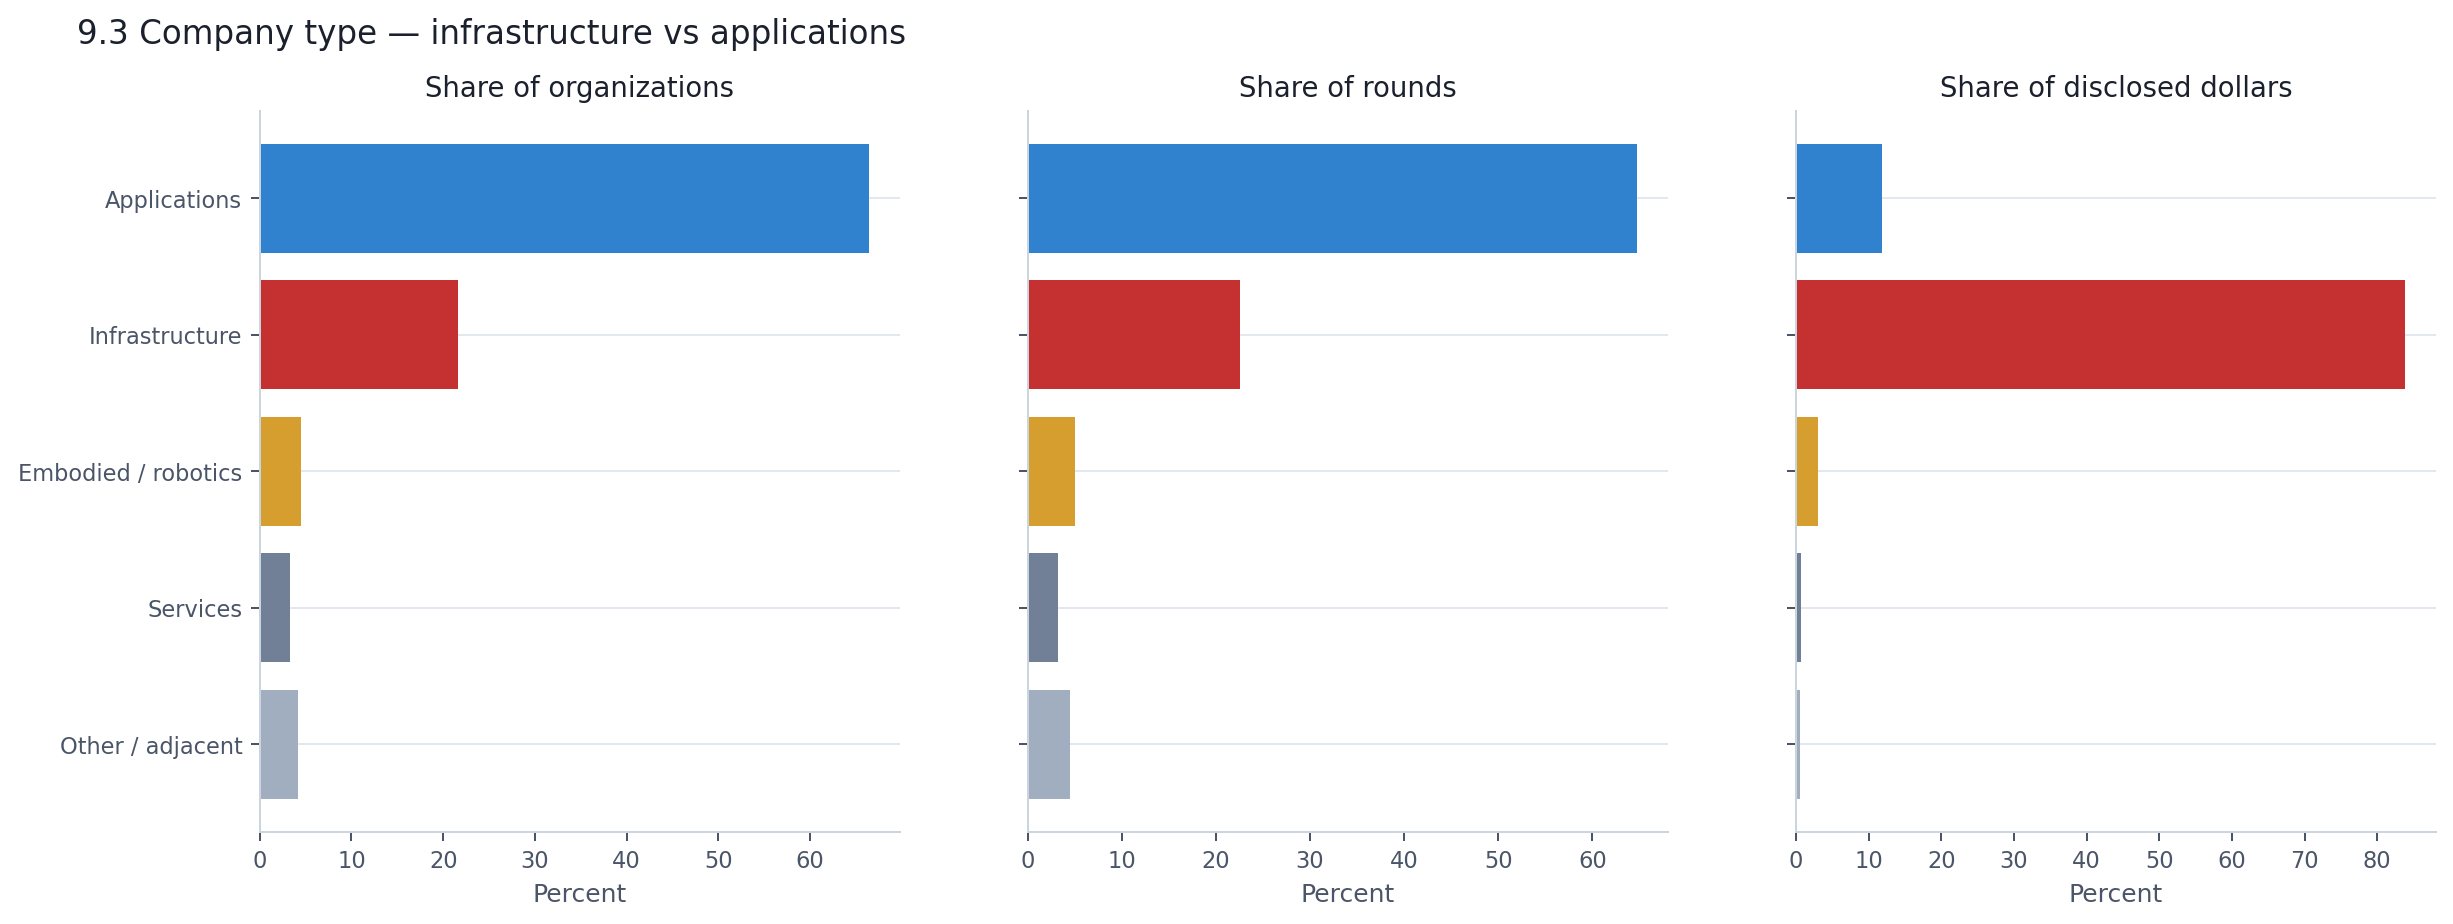
Applications: 66.5% of companies, 64.8% of rounds, 11.9% of disclosed dollars.
Infrastructure: 21.6% of companies, 22.5% of rounds, 83.9% of disclosed dollars.
That is not a gradual tilt. It is a structural inversion. The market that most founders experience — raising a seed or Series A for an application — and the market that headlines describe — tens of billions flowing into AI — are almost entirely different pools of activity.
There is another way to cut this. Not by stack layer, but by how central AI is to what the company does.
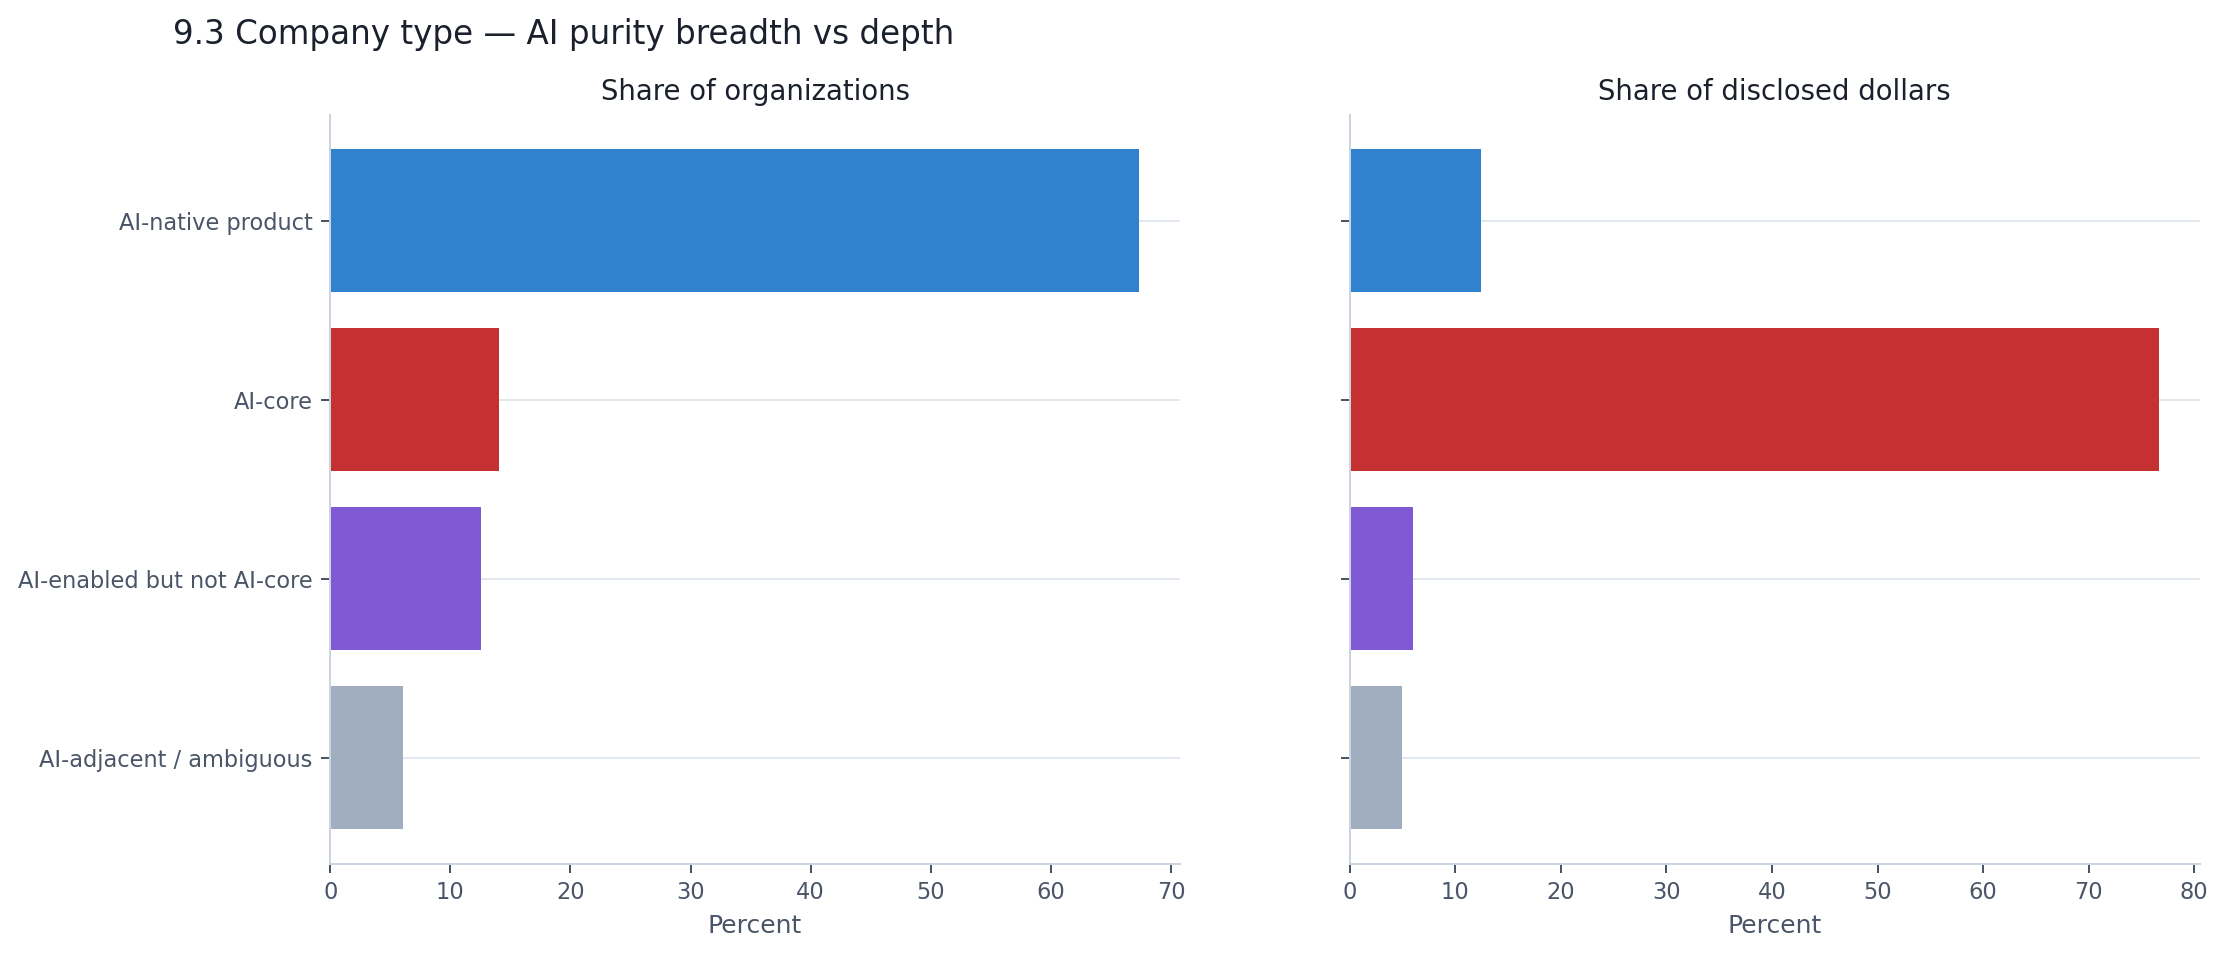
AI-native products — companies that use AI as a core capability but are ultimately defined by the product they deliver — make up 67% of companies and receive 12% of disclosed dollars. AI-core companies — those building foundational AI technology itself — make up 14% of companies and receive 77% of disclosed dollars.
This is the same infrastructure-versus-applications story told through a different lens, and it lands the same way. The broad ecosystem is building with AI. The capital is flowing to companies building AI itself.
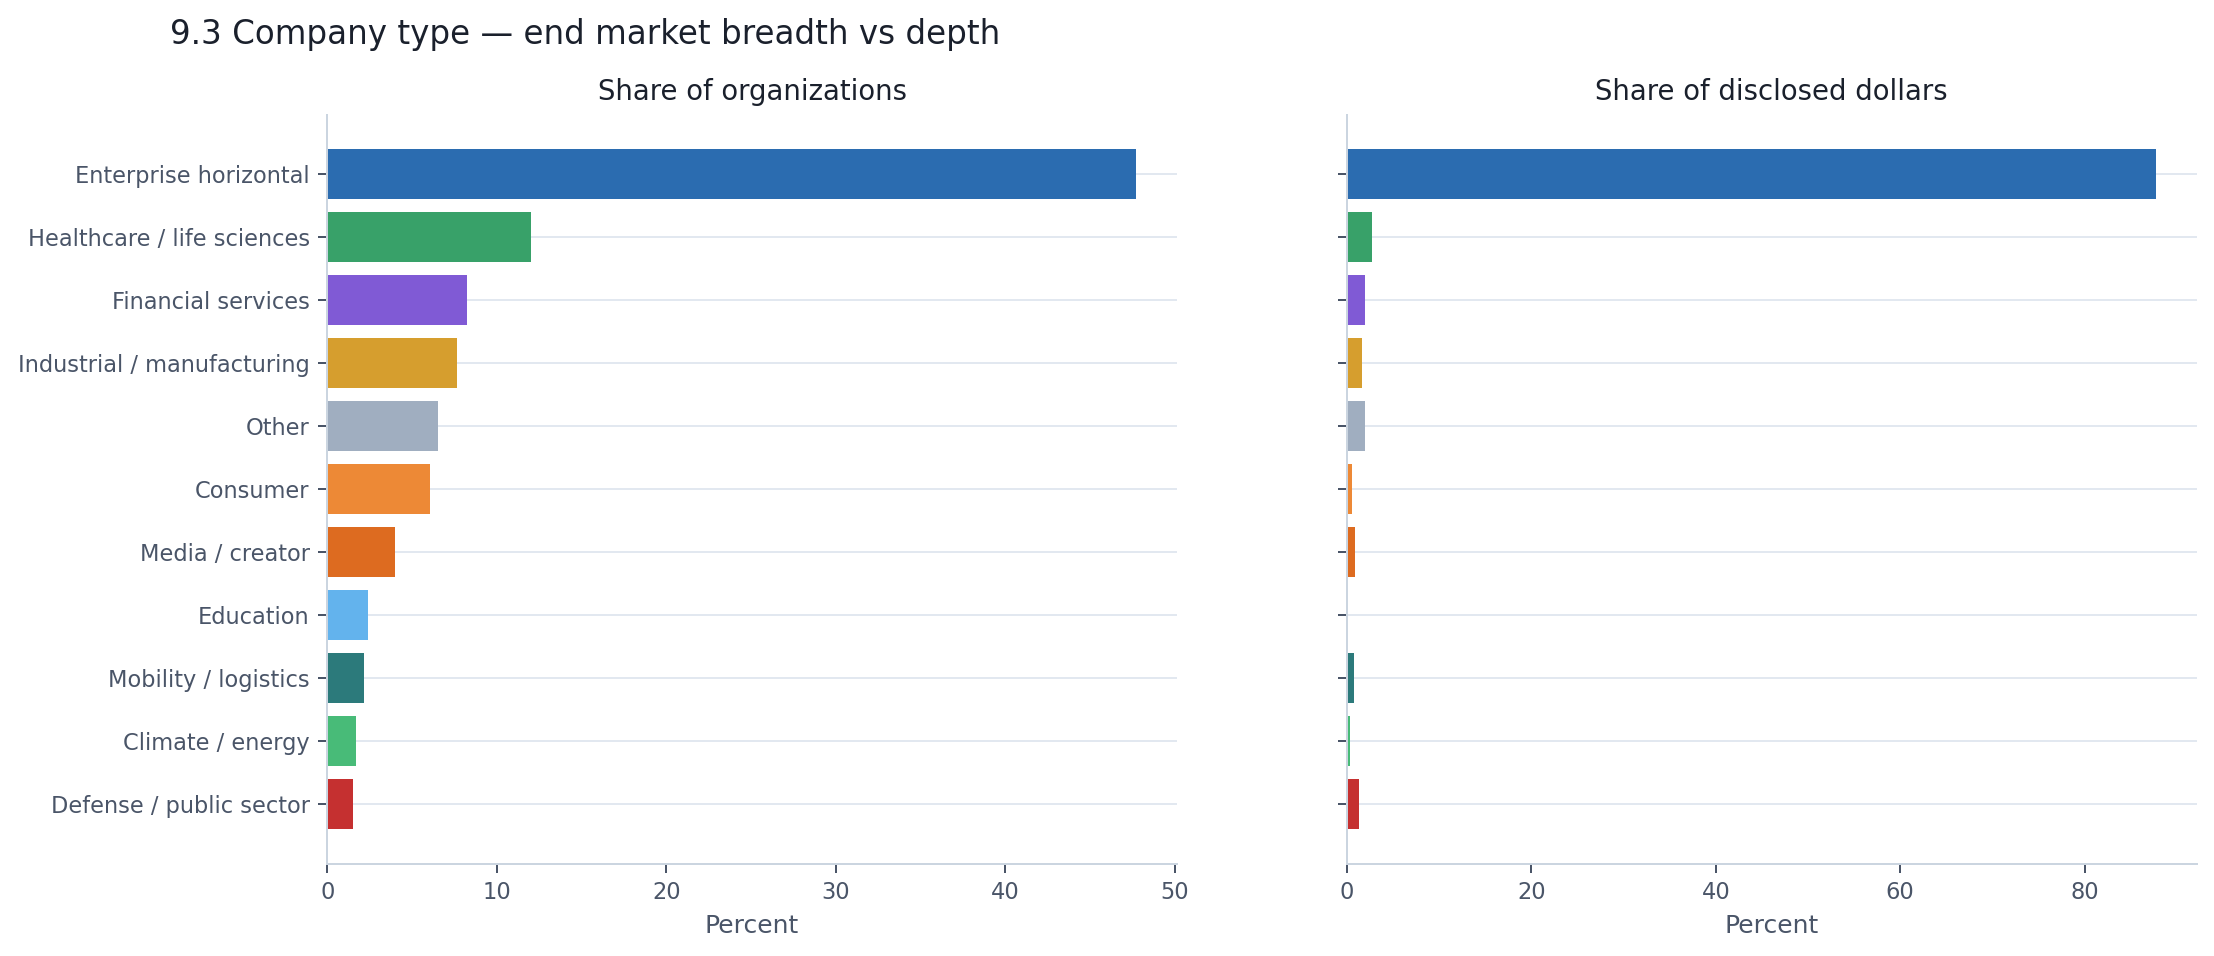
A brief note on end markets, because the pattern here is different.
Enterprise horizontal dominates both breadth and capital — 48% of companies and 88% of disclosed dollars. That sounds like a single-winner market, but the number is somewhat misleading. Many infrastructure and platform companies are classified into enterprise horizontal because that is where their revenue comes from, even though their technology is general-purpose. So the 88% figure reflects the commercial gravity of enterprise buyers, not the narrowness of AI's reach.
Outside enterprise, end markets are broad but financially thin. Healthcare has 12% of companies and 2.7% of disclosed dollars. Financial services has 8% and 2%. Consumer has 6% and 0.5%. The vertical end markets are real — they just have not yet attracted capital at the scale the enterprise-facing categories have.
The AI financing market is structurally lopsided. The ecosystem's breadth lives in applications — thousands of companies building AI into specific workflows, products, and industries. The ecosystem's capital depth lives in infrastructure — a small number of foundation model developers and compute providers absorbing the overwhelming majority of disclosed dollars.
This is not necessarily a problem. Infrastructure is expensive. Training frontier models and building data centers requires capital at a scale that no vertical SaaS company needs. But it does mean that the "AI funding boom" is really two different markets wearing the same label. One is broad, early-stage, and modestly funded. The other is narrow, capital-intensive, and enormous. The next chapter looks at whether either of them is maturing.
If you count rounds, the AI market looks very young. If you follow the dollars, it does not look young at all. And if you look closely, a surprising amount of the capital sits in rounds that resist stage labeling entirely.
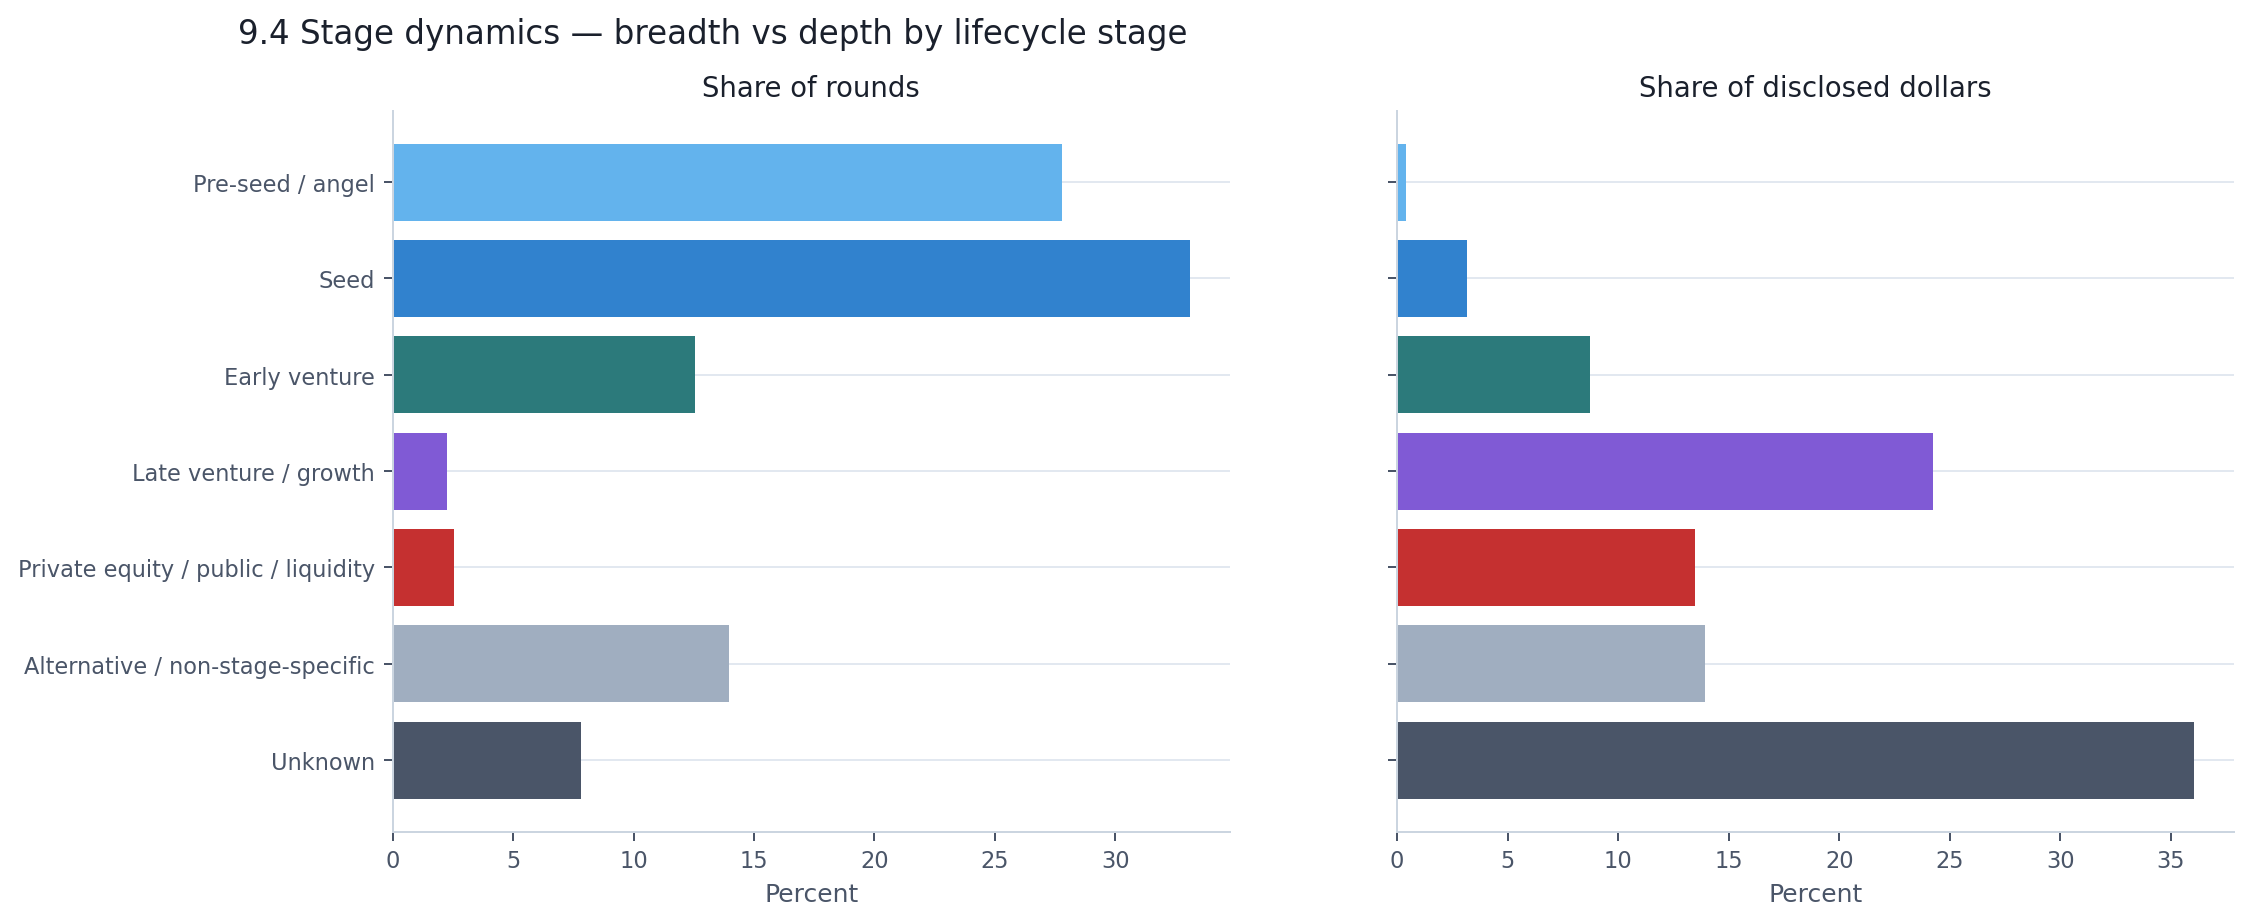
| Stage | % of rounds | % of disclosed $ | Median round |
|---|---|---|---|
| Pre-seed / angel | 27.8% | 0.4% | $0.5M |
| Seed | 33.1% | 3.1% | $3.0M |
| Early venture | 12.5% | 8.7% | $20.0M |
| Late venture / growth | 2.2% | 24.3% | $101.0M |
| PE / public / liquidity | 2.5% | 13.5% | $12.0M |
| Alternative / non-stage-specific | 14.0% | 13.9% | $0.2M |
| Unknown | 7.8% | 36.1% | $5.6M |
The broad-base versus capital-peak split is familiar from Section 3. What the table adds is the step size between stages. A seed company raises $3M. An early-venture company raises $20M. A late-stage company raises $101M. From seed to late venture, that is a 34× jump in median round size — and late venture represents just 2.2% of all activity.
A meaningful share of capital does not fit neatly into the standard venture-stage ladder. Unknown-stage rounds account for 36% of disclosed dollars, and together with alternative/non-stage-specific financing they make up more than half of the visible total. That is worth keeping in mind, but the broader maturity story is still clear.
The previous chapter showed that applications and infrastructure are essentially different markets by capital. The stage data shows they are at different points of maturity too.
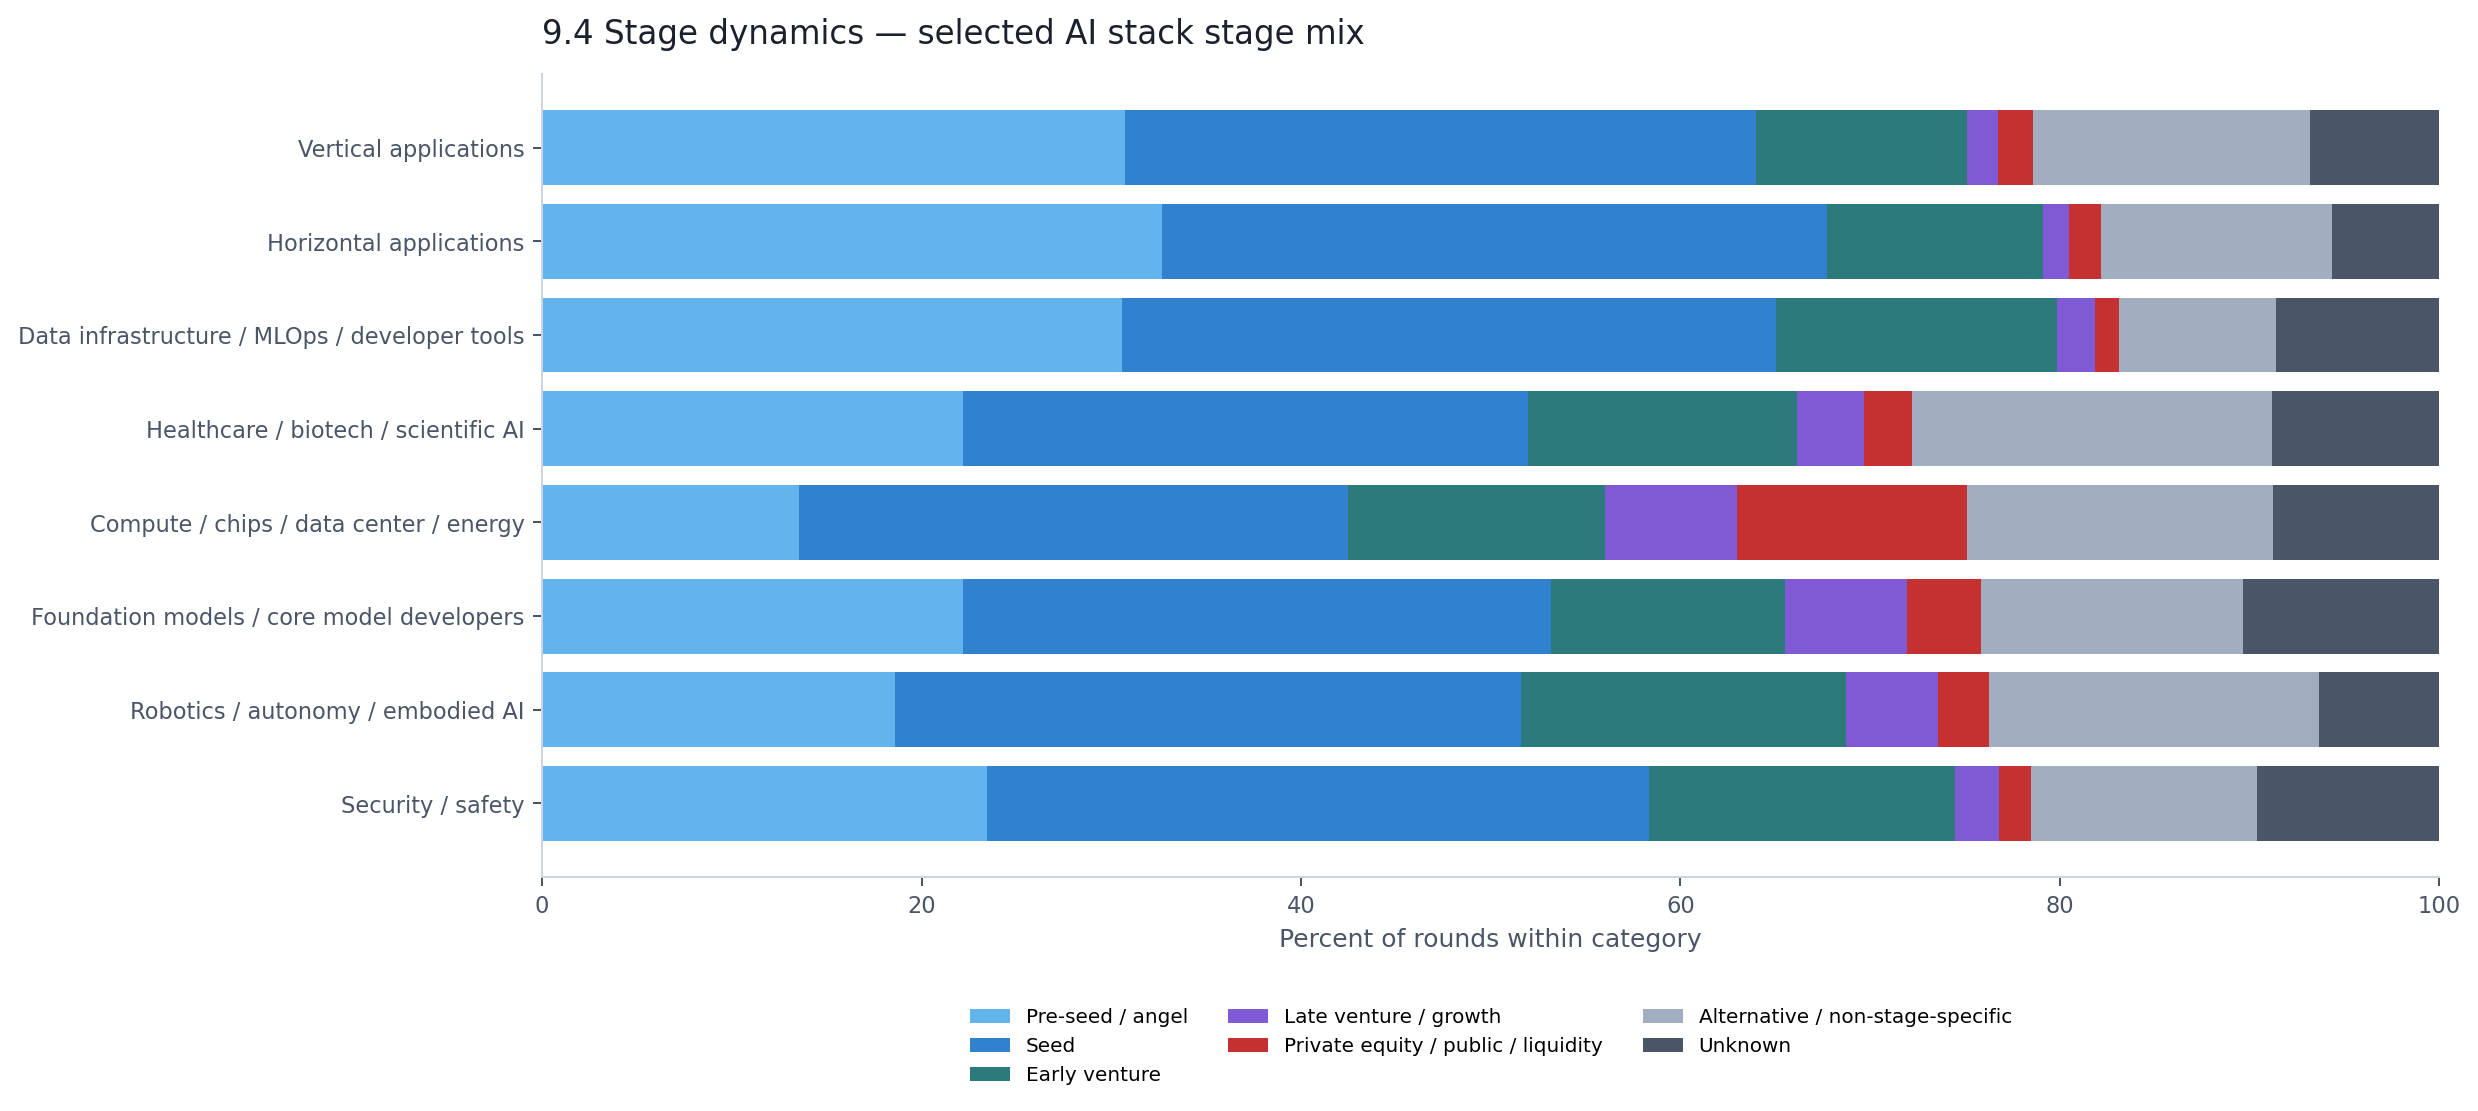
Vertical and horizontal applications look unmistakably early. About two-thirds of their rounds are pre-seed or seed. They are broad, young, and raising small amounts. That tracks with what Section 5 already showed — the application layer is where the ecosystem is widest.
Foundation models tell a different story. They still have plenty of early-stage rounds by count, but 58% of their disclosed dollars sit in unknown-stage rounds alone. That is largely the gravitational pull of a few enormous financings — like OpenAI's $122 billion round — that defy clean stage labels. For compute, 42% of disclosed dollars sit in PE/public/liquidity and another 26% in alternative financing. These are not companies climbing the venture ladder. They are companies accessing capital markets that the traditional stage framework was never designed to describe.
The practical implication: if you use stage as a maturity signal, application categories look early and infrastructure categories look mature. But the infrastructure categories are not just "later stage" — they are partly stage-illegible, operating in financing structures that venture-stage labels cannot capture.
Among the 857 companies that raised more than once during the window, we can track whether they moved up the stage ladder between their first and last observed round.
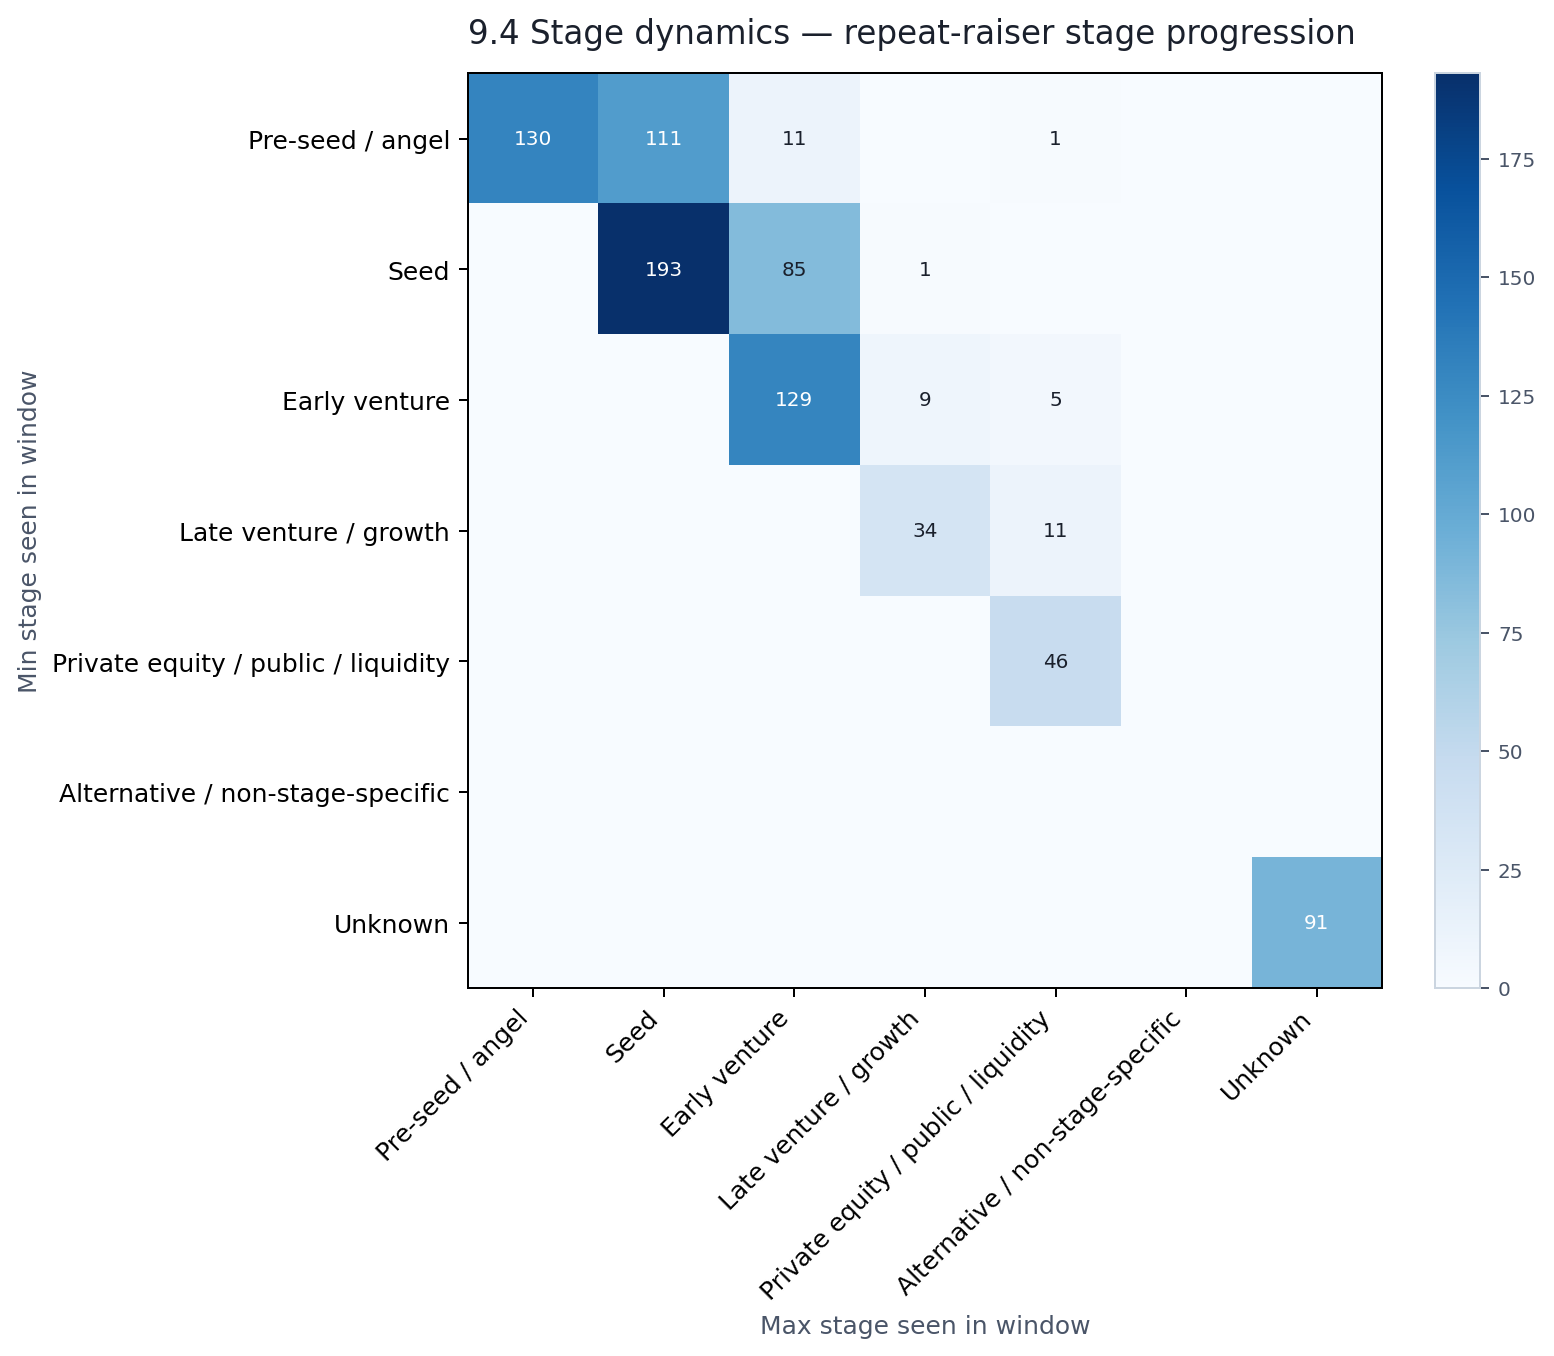
The diagonal tells the story. Of the 766 repeat raisers with comparable stage data, 70% stayed at the same stage. Only 30% advanced. The most common pattern was Seed → Seed (193 companies), followed by Pre-seed → Pre-seed (130) and Early venture → Early venture (129). The most common advancement was Pre-seed → Seed (111 companies), then Seed → Early venture (85).
This does not mean these companies are stuck. A twelve-month window is simply too short to observe full lifecycle progression for most startups. What it does tell us is that the repeat fundraising we see in this dataset is more recursive than developmental — companies raising again at the same stage, topping up, extending runways — rather than a neat march from seed to Series A to Series B.
The AI market's maturity profile mirrors its capital profile: lopsided. The broad base is genuinely early — thousands of seed and pre-seed companies in the first stages of building. The capital peak is genuinely later — but "later" often means outside the venture-stage framework entirely, in financing structures that look more like infrastructure project finance or public-market capital raises than traditional venture rounds.
And when companies raise again within the year, the dominant pattern is not graduation. It is repetition. The market is not climbing a ladder so much as circling within stages — especially at the early end — while a few capital-intensive players at the top operate in a stage category of their own.
AI companies are everywhere. AI capital is not.
The dataset spans 90+ countries. Companies from Europe and Asia-Pacific each make up roughly 18% of the organizational base — a genuinely global footprint. But when you shift from counting companies to counting dollars, the map collapses. The Americas account for 54% of organizations and 83% of disclosed dollars. Europe and Asia-Pacific, despite their combined 37% of companies, share just 15% of the capital between them.
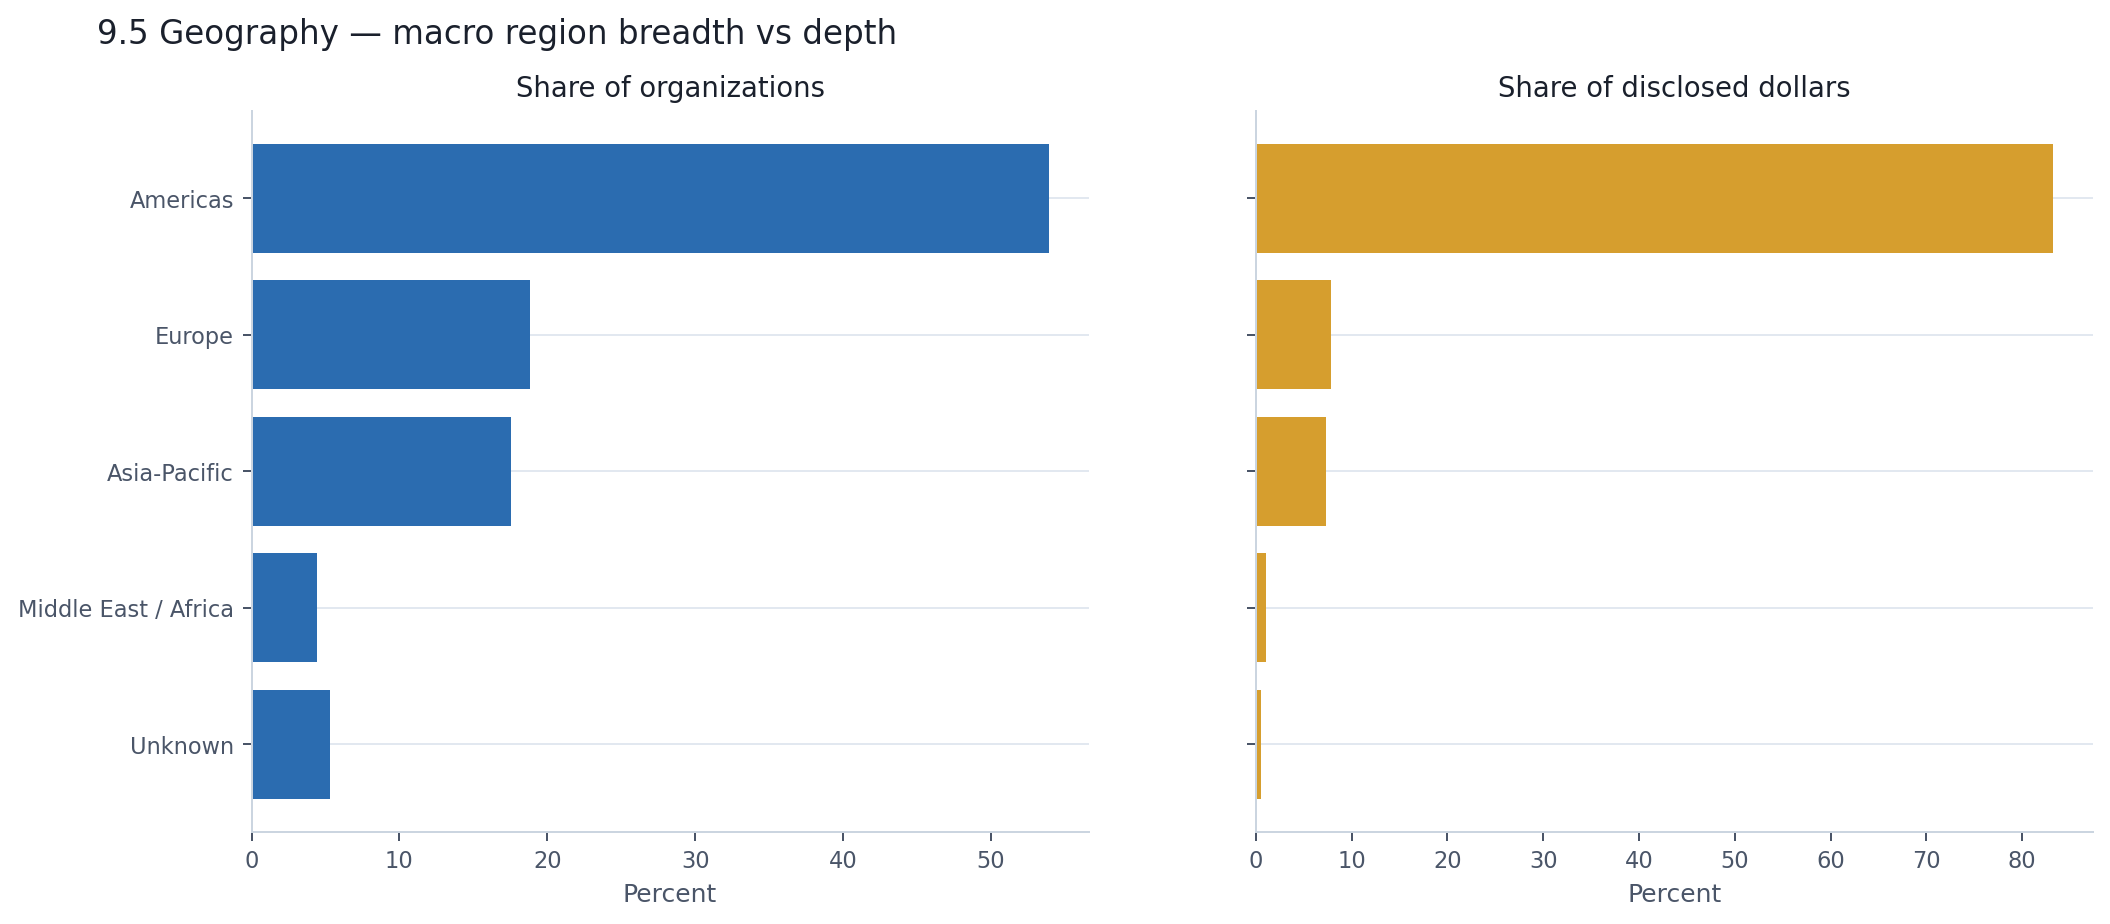
The United States alone tells most of that story. It accounts for half the announcements and half the organizations — a large share, but not an overwhelming one. Then you look at dollars: 83% of all disclosed capital traces back to U.S.-headquartered companies. The gap between 50% participation and 83% capital is not subtle. It means the average disclosed round from a U.S. company is far larger than one from anywhere else, driven by the infrastructure mega-rounds that earlier chapters already identified.
The most interesting thing about the non-U.S. landscape is how different it looks depending on which metric you use.
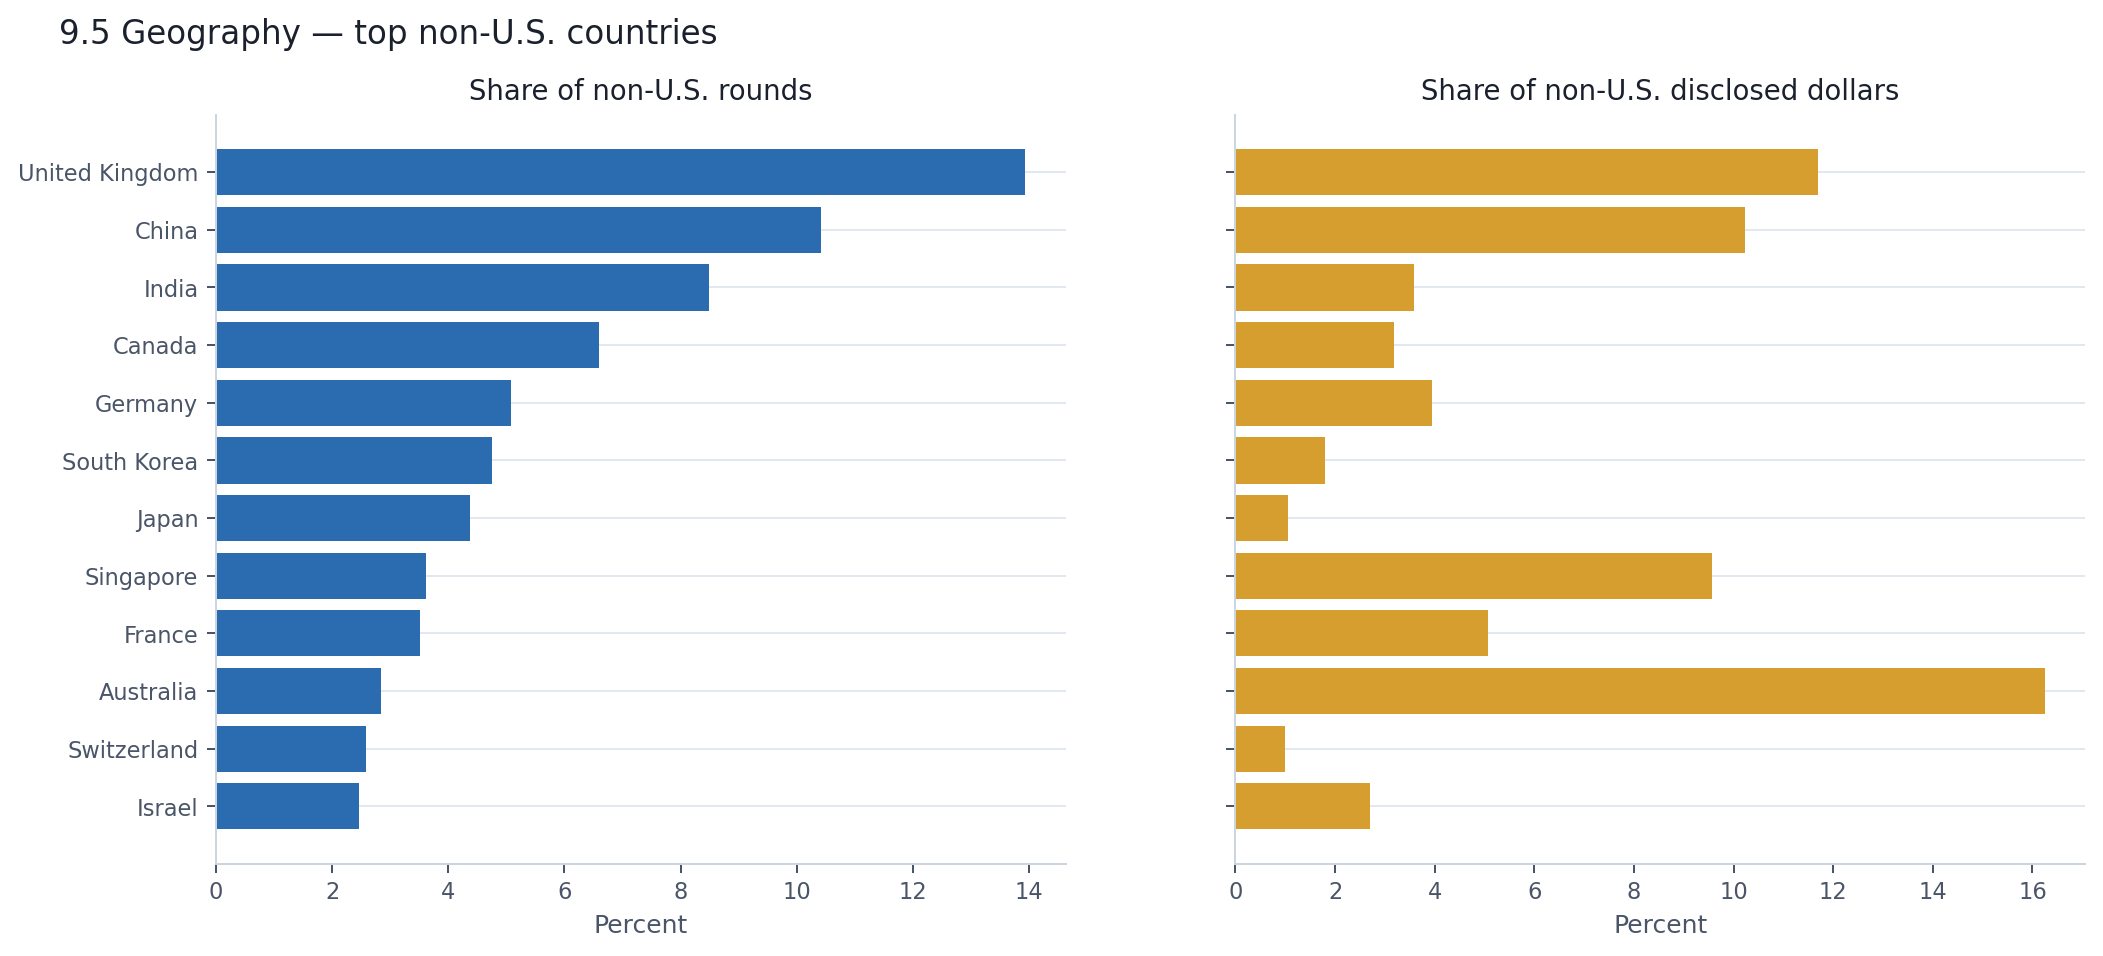
The United Kingdom leads non-U.S. activity with 14% of non-U.S. rounds — a broad ecosystem of mostly early-stage companies. But it captures only 12% of non-U.S. disclosed dollars, putting it third by capital. China is second by activity at 10% of non-U.S. rounds, but its dollar figure comes with a major asterisk: only 39% of Chinese rounds disclose an amount, the lowest rate among major countries. Its visible capital position almost certainly understates reality.
The real surprise is Australia. It contributes just 2.8% of non-U.S. rounds but 16% of non-U.S. disclosed dollars — the largest non-U.S. capital share by a wide margin. Singapore shows a similar pattern at a smaller scale: 3.6% of non-U.S. rounds, 9.6% of non-U.S. dollars. Both countries are being pulled upward by a small number of large rounds rather than by broad ecosystem activity. Ireland is even more extreme — 0.9% of non-U.S. rounds, nearly 20% of non-U.S. disclosed dollars — almost certainly driven by one or two very large financings.
The pattern is familiar by now. A few large checks can make a country look capital-rich. Broad company formation tells a different, and usually more durable, story.
Within Europe, the EU accounts for 57% of European rounds and 72% of European disclosed dollars. The UK contributes 34% of rounds but 25% of dollars. The rest of Europe — Switzerland, Norway, and others — adds 10% of rounds and just 3% of capital.
If the global picture concentrates into the U.S., the U.S. picture concentrates into California. At the state level, California accounts for 47% of U.S. rounds and 79% of U.S. disclosed capital, while every other state trails far behind.
The metro level sharpens this further. San Francisco alone accounts for 28% of U.S. rounds and 61% of U.S. disclosed dollars. Add Palo Alto, San Jose, Mountain View, Menlo Park, Sunnyvale, and San Mateo — all fragments of the same Bay Area — and the combined figure reaches roughly 39% of U.S. rounds and 77% of U.S. disclosed dollars.
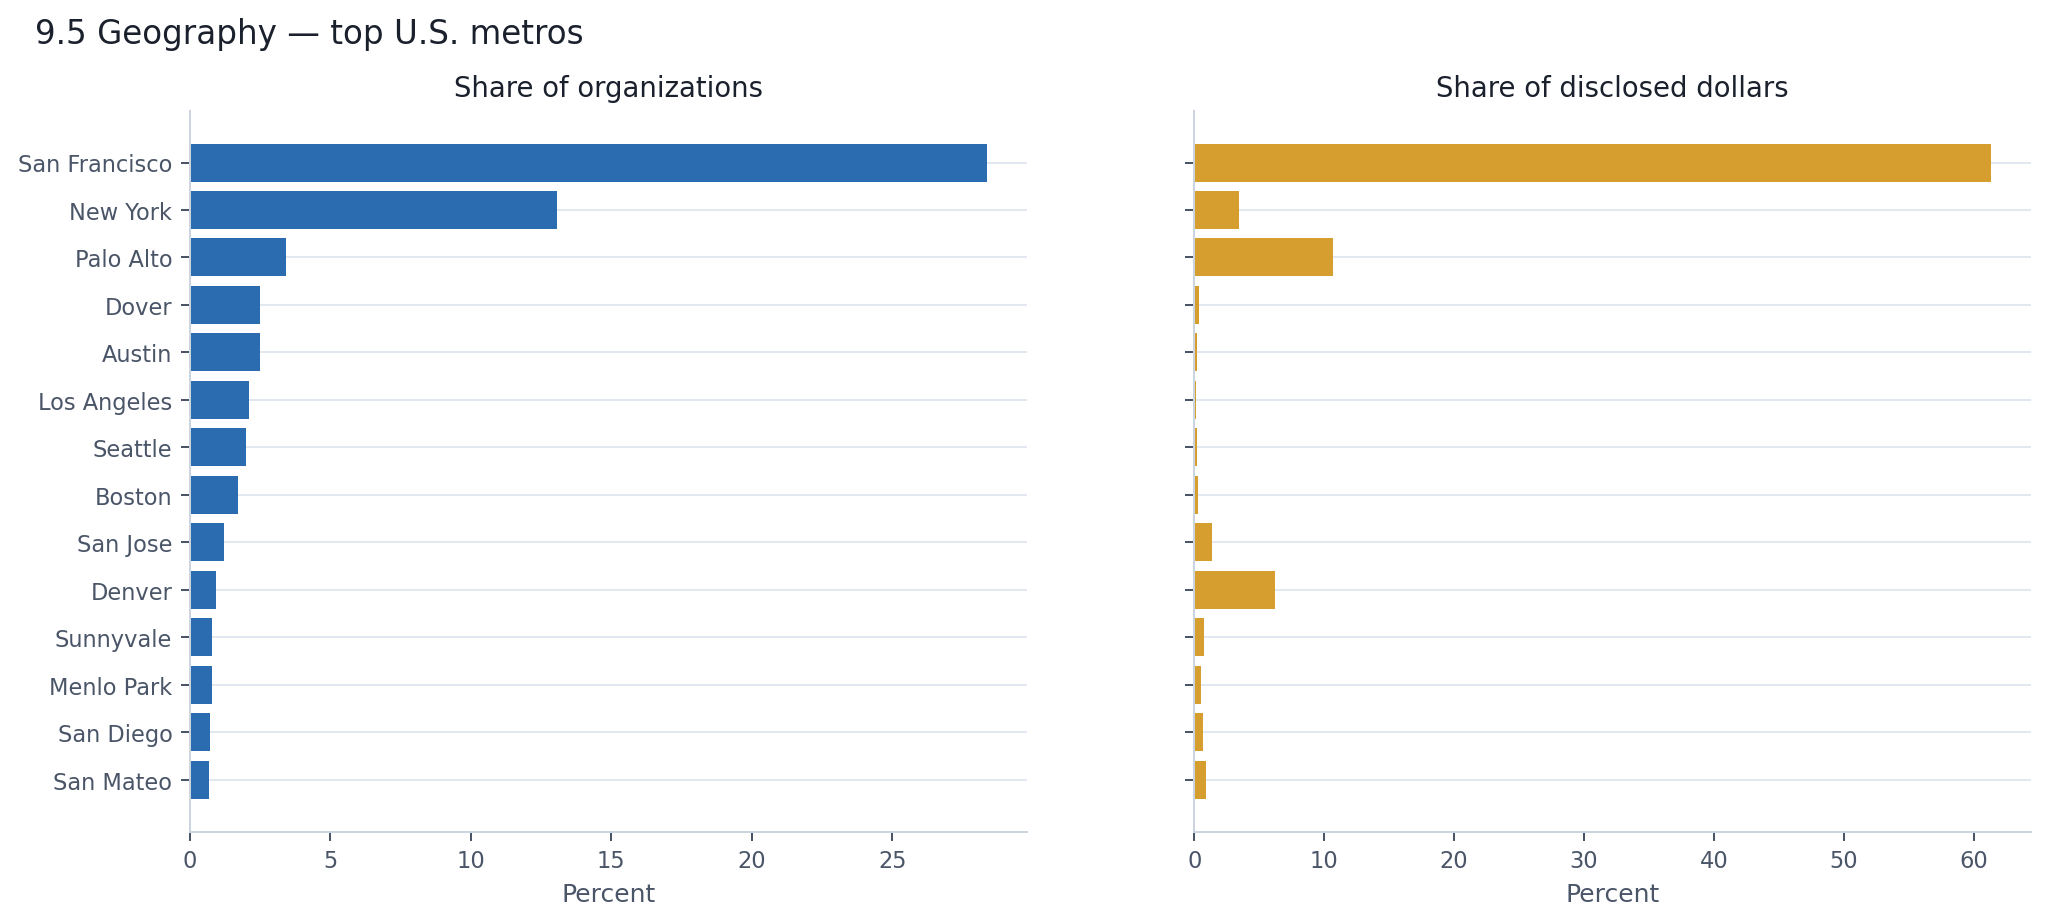
New York, the second-largest metro by company count, captures 3.5% of U.S. disclosed dollars. Denver, which barely registers by round count, shows 6.2% of dollars — another case of a few large rounds reshaping the capital map. The metro labels also include places like Dover and Wilmington, which reflect legal incorporation addresses rather than actual AI hubs.
Geography follows the same structural logic as everything else in this report. The footprint is broad — 90+ countries, multiple U.S. hubs, a genuinely international early-stage ecosystem. The capital is narrow — overwhelmingly American, overwhelmingly Californian, overwhelmingly Bay Area. That is not because the rest of the world lacks AI companies. It is because the mega-round, infrastructure-heavy capital layer that dominates disclosed dollars is physically concentrated in a very small number of places.
For any country or city trying to build an AI ecosystem, the implication is straightforward: breadth of company formation is achievable and already happening globally. Capital depth — the kind that funds foundation models and data centers — remains extraordinarily concentrated.
Earlier chapters kept circling around the same observation: a small number of very large rounds dominate the dollar totals. This chapter stops circling and measures it directly. The answer is more extreme than the earlier hints suggested — and it holds up even after you try to explain it away.
Section 3 established that mega rounds dominate the dollar tape. This chapter measures how far the dominance actually goes. The top 10 disclosed rounds — ten individual financing events out of nearly 6,000 with known amounts — account for 58% of all disclosed dollars. The top 1% account for 79%. The remaining 99% of activity — thousands of seed checks, Series As, grants, and debt facilities — shares barely a fifth of the visible capital between them.
The natural question is: what does the market look like without those mega rounds? Much flatter.
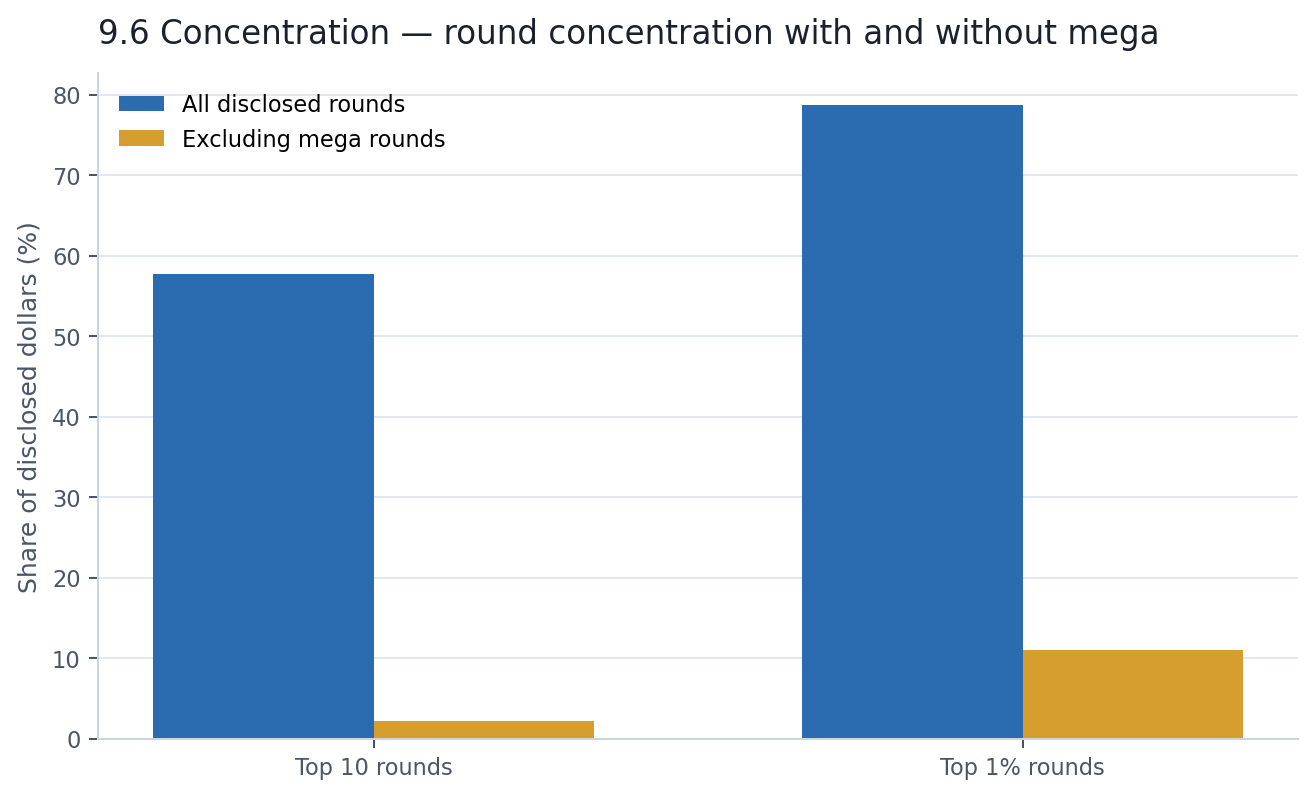
With mega rounds removed, the top 10 rounds account for just 2.2% of the remaining disclosed dollars. The top 1% account for 11%. That is still a power-law distribution — capital markets always are — but it is a recognizably normal one. The extreme headline concentration is not a feature of the broad AI market. It is a feature of a very thin mega-round layer sitting on top of it.
You might think: maybe the headline concentration is just a handful of press-release-friendly mega rounds distorting an otherwise healthier picture. Move to the company level, where capital accumulates over multiple rounds, and perhaps things even out.
They do not. The top 10 companies by disclosed capital in-window absorb 68% of all disclosed dollars. The top 1% of companies — about 54 organizations — absorb 83%. And here is the test that matters: restrict the analysis to fresh capital only, excluding liquidity and secondary transactions. The top 10 companies still account for 68%. The top 1% still account for 82%.
The concentration is not an artifact of double-counting, liquidity transactions, or accounting quirks. It is structural. A very small number of companies genuinely absorbed most of the visible capital.
The cumulative share chart shows all three views at once — rounds, organizations, and rounds excluding mega — and the shape of the curves says more than any table can.
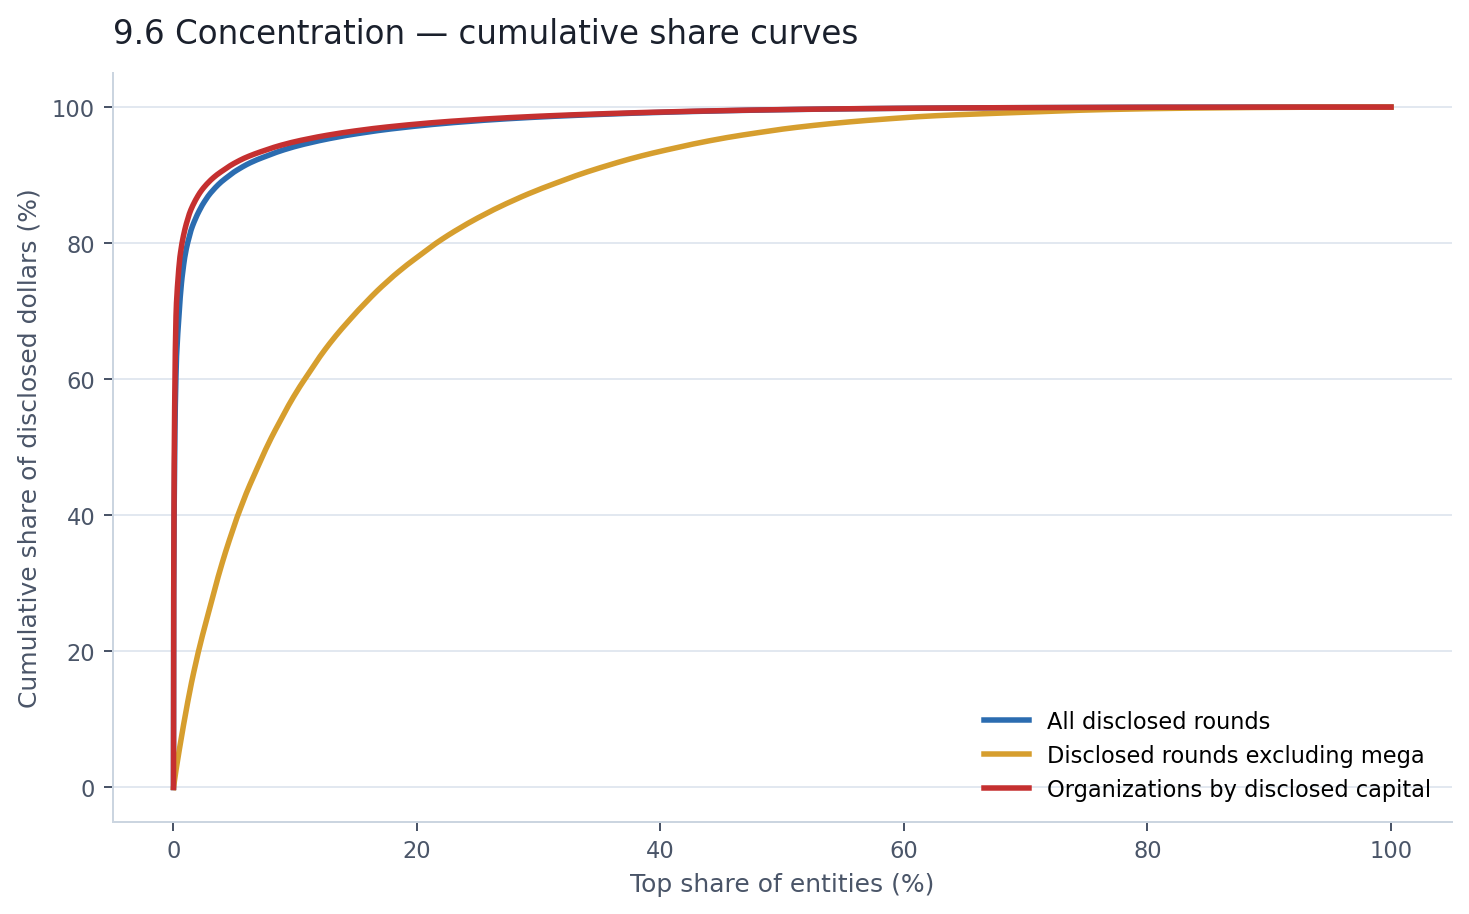
The blue and red lines are nearly vertical at the left edge. By the time you reach 5% of entities, you have already passed 90% of disclosed dollars. The gold line — rounds excluding mega — is the only one that looks like a functioning market.
This is where the concentration story connects back to the company-type chapter. It is not just that infrastructure categories dominate disclosed dollars. It is that the capital within those categories is almost entirely held by a handful of names.
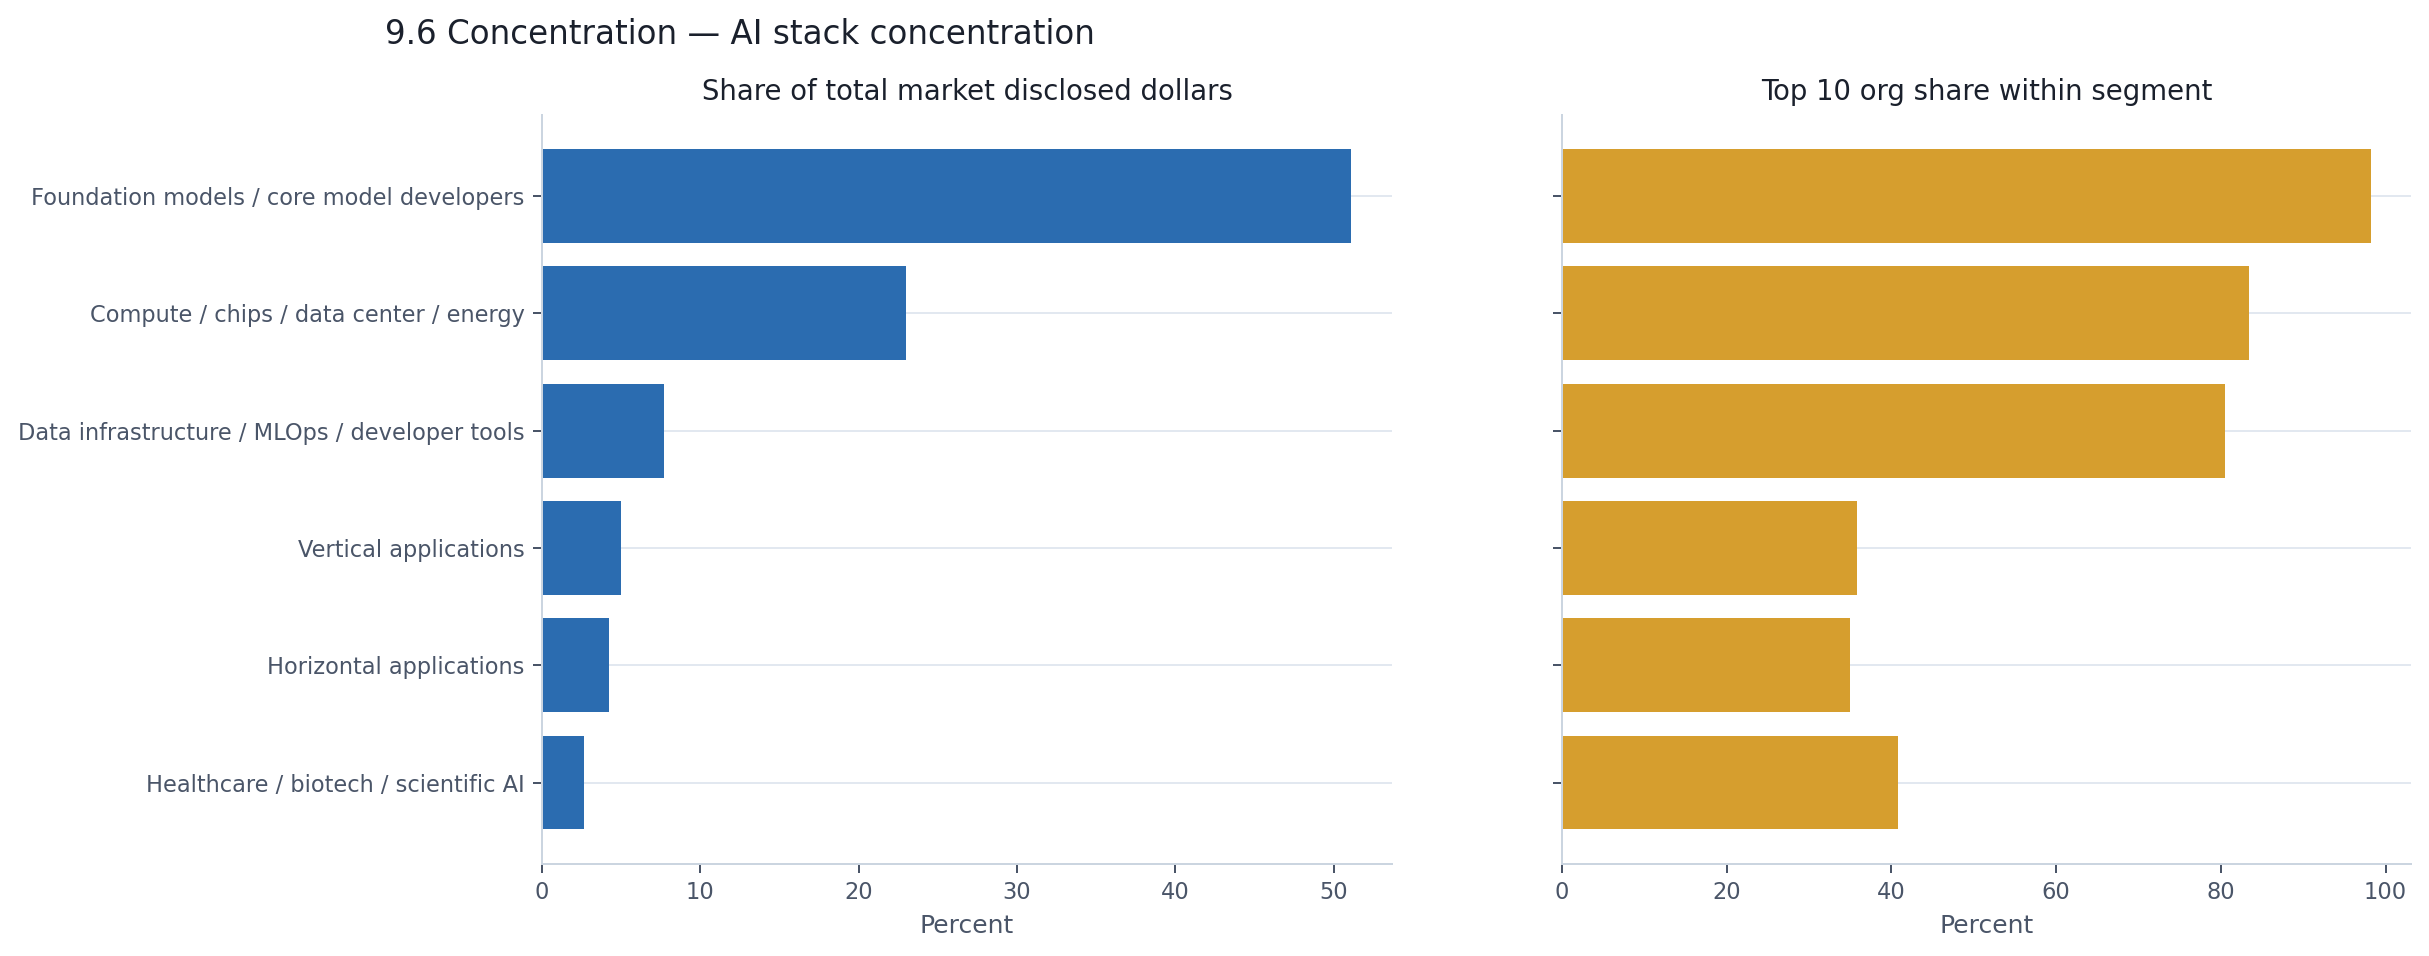
Foundation models account for 51% of the market's disclosed dollars. Within that category, the top 10 organizations hold 98% of the segment's capital. That is not concentration in the usual venture sense. That is essentially the entire segment.
Compute accounts for 23% of market dollars, with 83% held by its top 10. Data infrastructure accounts for 8%, with 81% held by its top 10. These are the market's three largest capital pools, and each of them is internally dominated by a very small set of winners.
The application categories look different. In vertical applications and horizontal applications, the top 10 organizations hold 36% and 35% of their respective segment capital. Still concentrated by most standards, but nothing like the infrastructure layers. The application market genuinely has a broader base of capital recipients.
| AI stack category | % of market $ | Top 10 org share within segment |
|---|---|---|
| Foundation models | 51.1% | 98.2% |
| Compute / data center | 23.0% | 83.4% |
| Data infra / MLOps / dev tools | 7.7% | 80.5% |
| Vertical applications | 5.0% | 35.9% |
| Horizontal applications | 4.2% | 35.0% |
| Healthcare / biotech / scientific AI | 2.7% | 40.8% |
The categories with the most capital are also the ones where that capital is most concentrated. The categories with the broadest company base have the least capital to distribute. Concentration and dollar dominance reinforce each other.
The previous chapter showed that capital is geographically concentrated. This chapter adds a second layer: even within each geography, a small number of companies carry the total.
Inside the U.S., the top 10 organizations account for 77% of U.S. disclosed capital. Inside Europe, the top 10 account for 75%. Inside Asia-Pacific, 72%. These are not markets where a broad ecosystem of companies shares the capital roughly evenly. They are markets where a few names define the visible total.
In smaller countries, this becomes even more extreme. In Ireland, a single organization accounts for 99% of disclosed capital. In Australia, one company holds 94%. In Singapore, one holds 84%. The previous chapter noted that some countries appeared capital-rich relative to their company count. This chapter explains why: they are not capital-rich markets. They are markets that happen to contain one or two very large recipients.
The AI financing market's concentration operates in layers, and each layer reinforces the others. A small number of mega rounds dominate the disclosed-dollar tape. A small number of companies absorb most of the capital even at the organization level. The categories where those companies sit — foundation models and compute — are themselves internally winner-take-most. And the geographies where they are headquartered inherit that concentration.
Remove any one of those layers and the market still looks concentrated. That is the difference between a market that happens to have a few outliers and a market whose entire capital structure is built around a few winners. This one is the latter.
The previous chapter showed that a few dozen companies carry most of the capital. This chapter asks a different question: how many of those companies came back for more within the same year? The answer reframes the entire market.
Of the 7,118 organizations in the dataset, 857 — exactly 12% — raised more than once during the window. That is a small minority. But those 857 companies account for 24% of all round rows and 82% of all disclosed capital.
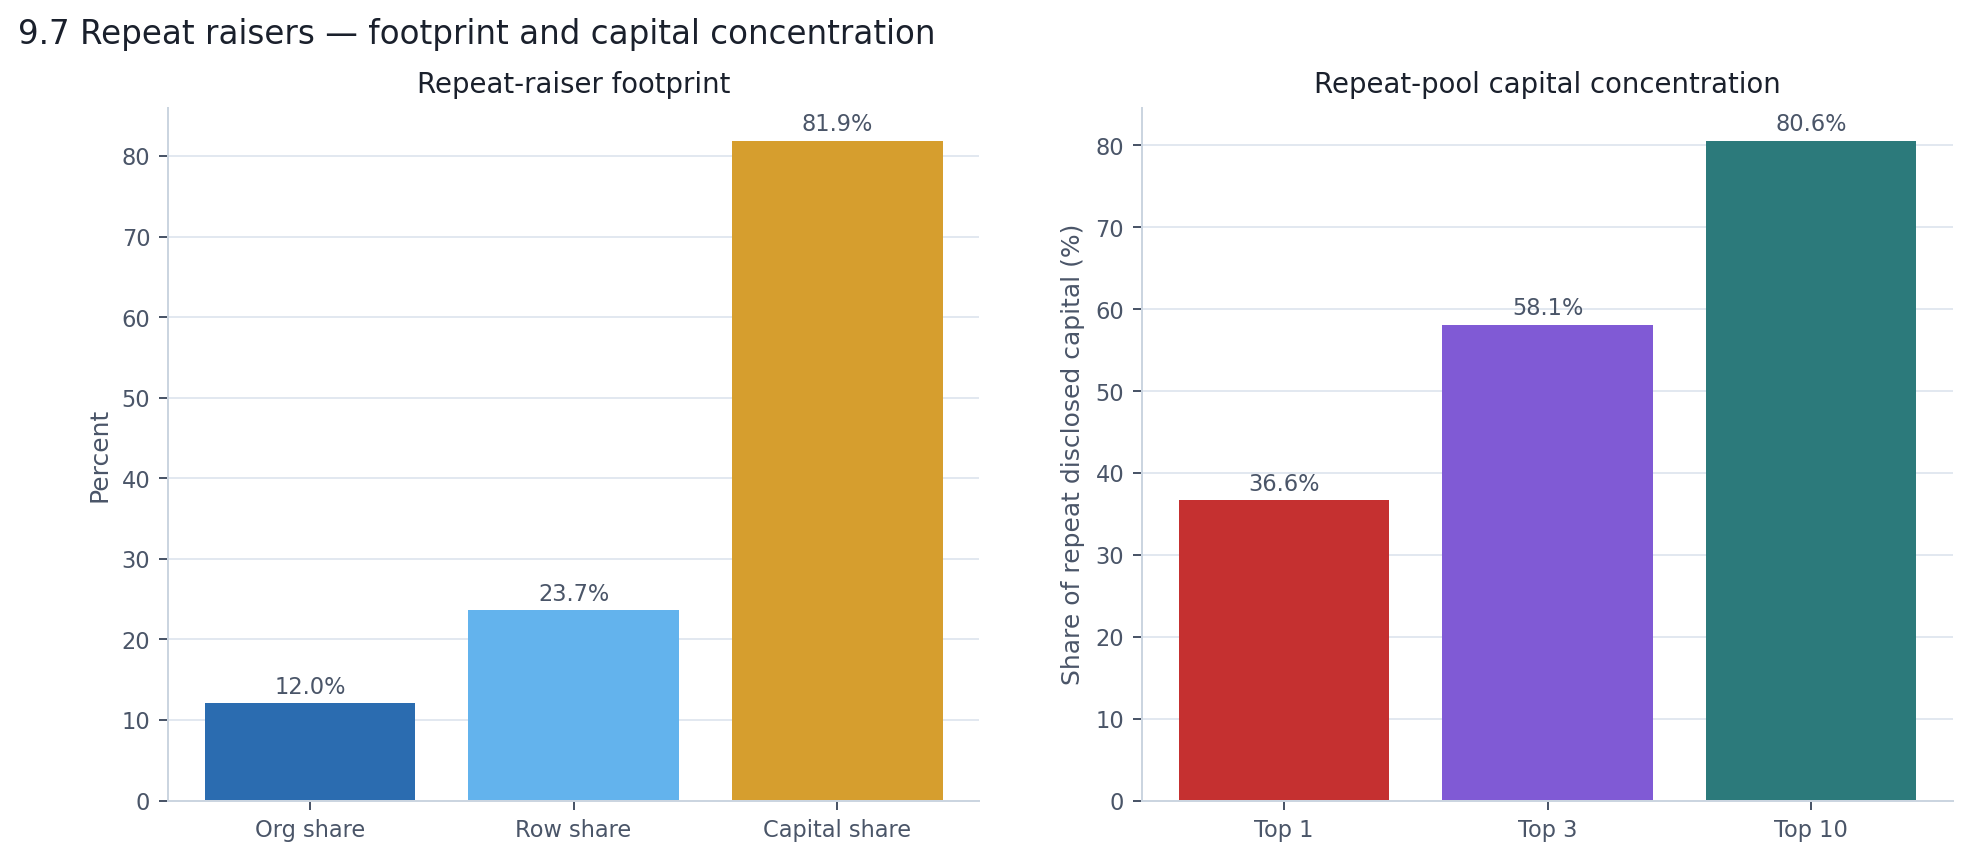
Read the left panel as a staircase: 12% of companies, 24% of activity, 82% of dollars. Each step roughly doubles. The right panel shows that even inside the repeat-raiser pool, capital is not spread evenly. The single top repeat raiser accounts for 37% of all repeat-raiser disclosed capital. The top three account for 58%. The top ten account for 81%. So it is not that 857 companies are sharing the bulk of the market's capital. It is that a small handful of companies, raising repeatedly, dominate everything.
The typical repeat raiser is not hyperactive. 83% raised exactly twice in the window. Another 12% raised three times. Only 12 companies raised five or more times. The repeat-raiser effect is driven less by a large cohort raising constantly and more by a small number of names raising at enormous scale.
The repeat-raiser effect is not uniform across the market. It is strongest in exactly the categories where capital concentration is already highest.
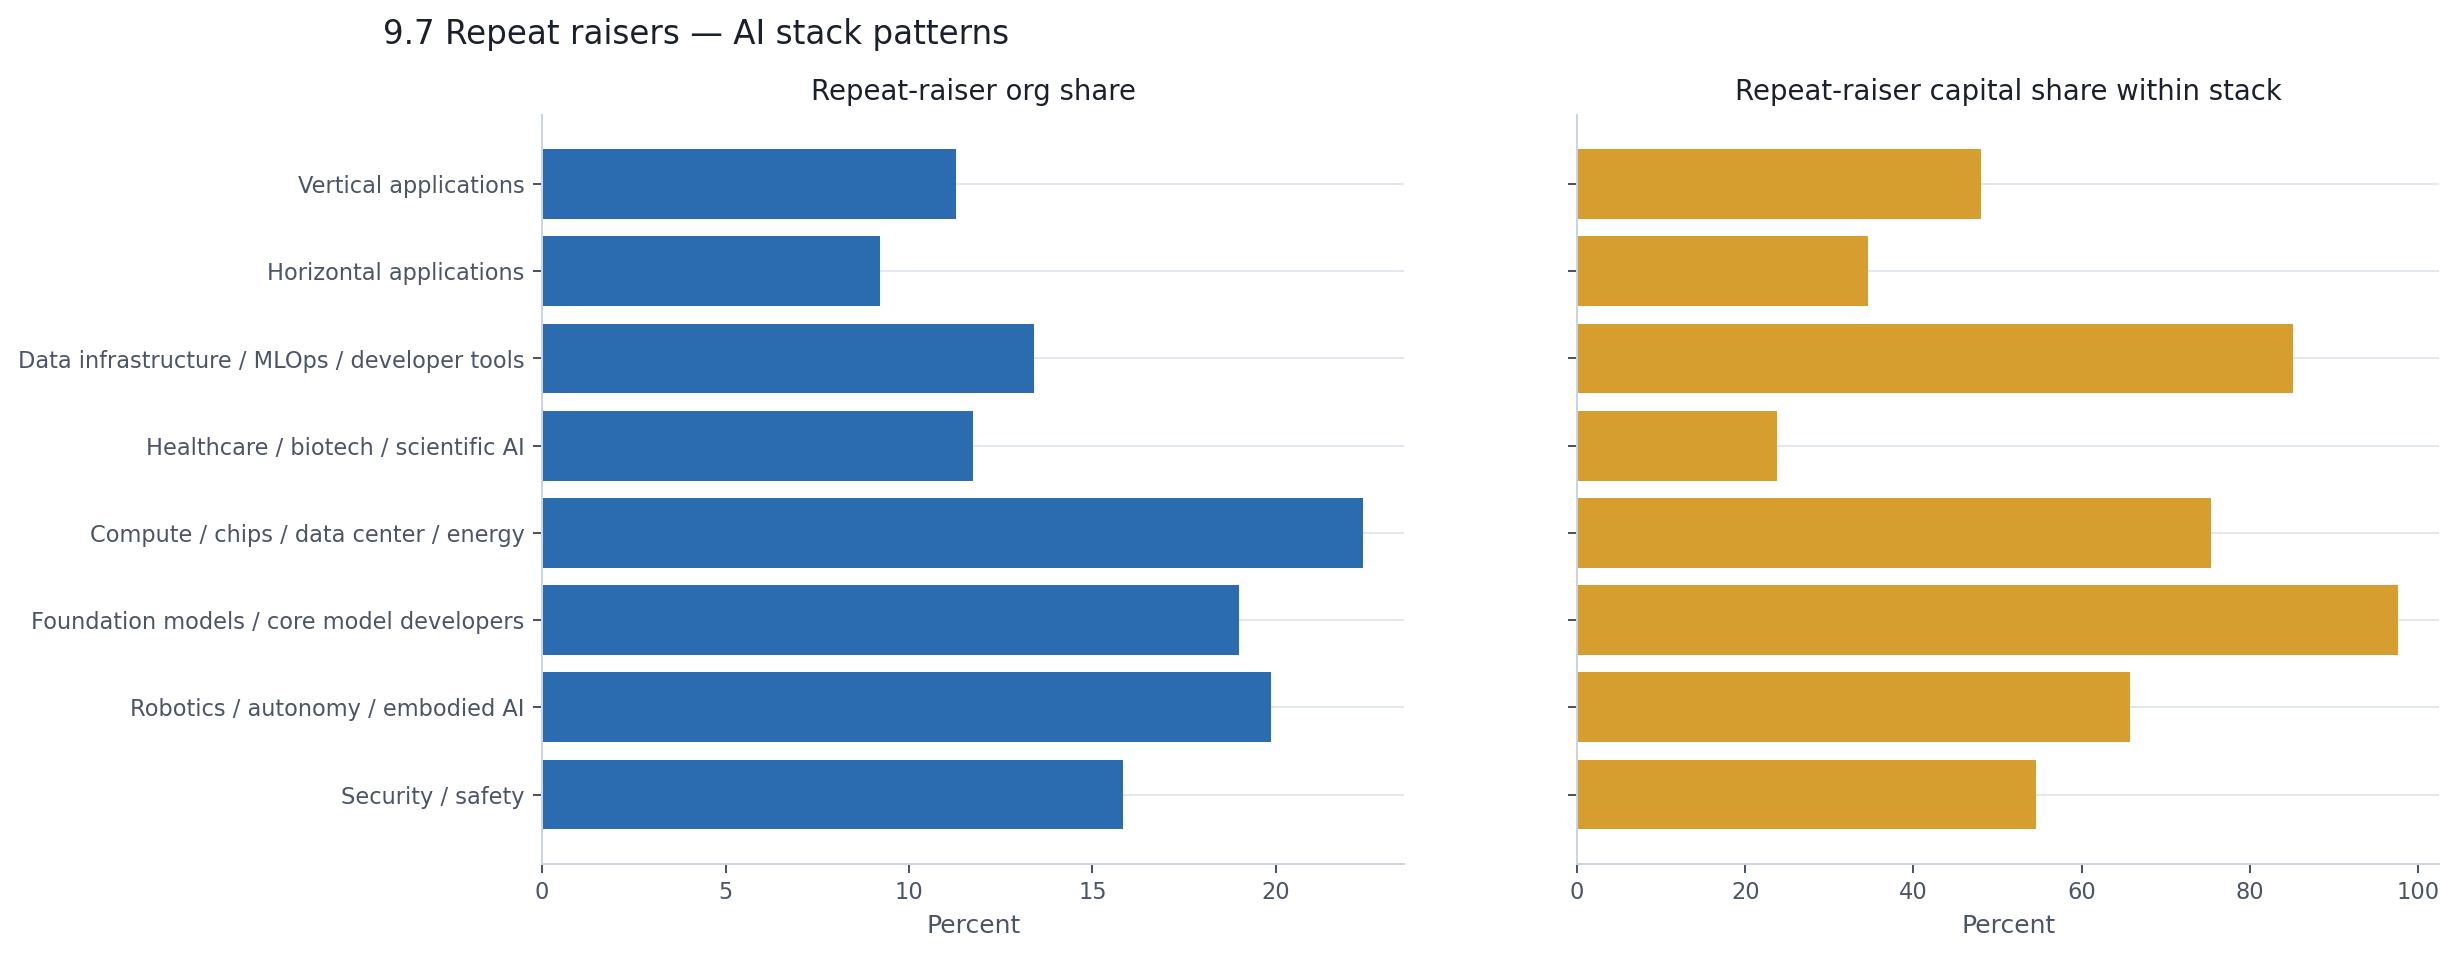
The left panel shows that repeat-raiser prevalence varies modestly — from about 9% of horizontal application companies to 22% of compute companies. The differences are real but not dramatic. Every category has repeat raisers.
The right panel is where the gap blows open. Repeat raisers account for 98% of disclosed capital in foundation models, 85% in data infrastructure, 75% in compute, and 66% in robotics. In those categories, almost all visible capital flows through companies that raised more than once.
The application layer is different. Repeat raisers account for 48% of capital in vertical applications, 35% in horizontal applications, and 24% in healthcare/biotech. These categories still have repeat raisers, but the capital base is much more distributed across one-time fundraisers. Infrastructure's capital pool, by contrast, is almost entirely a repeat-raiser phenomenon.
| Category | Repeat-raiser org share | Repeat-raiser capital share |
|---|---|---|
| Foundation models | 19.0% | 97.6% |
| Data infra / dev tools | 13.4% | 85.1% |
| Compute / data center | 22.4% | 75.4% |
| Robotics / autonomy | 19.9% | 65.7% |
| Security / safety | 15.8% | 54.6% |
| Vertical applications | 11.3% | 48.1% |
| Horizontal applications | 9.2% | 34.6% |
| Healthcare / biotech | 11.7% | 23.8% |
The geography split tells the same story from a different direction. Repeat-raiser prevalence is nearly identical across macro regions — roughly 12% everywhere. But repeat-raiser capital share differs enormously: 87% in the Americas, 82% in Asia-Pacific, but only 40% in Europe and 39% in the Middle East/Africa. The Americas and Asia-Pacific are not just capital-heavy because they have more companies. They are capital-heavy because the repeat-fundraising cohort within those regions absorbs nearly all the visible money.
The median repeat raiser spans 133 days from first to last announcement in the window, with a median gap of 104 days between rounds. That is roughly one fundraising event every three and a half months — fast enough to matter, but not unusual for high-growth companies in a capital-intensive market.
What is more revealing than speed is direction. Among repeat raisers with comparable stage data, 70% stayed at the same normalized stage between their first and last round. Only 30% advanced. The most common patterns were Seed → Seed (193 companies), Pre-seed → Pre-seed (130), and Early venture → Early venture (129). The most common actual advancement was Pre-seed → Seed (111 companies), then Seed → Early venture (85).
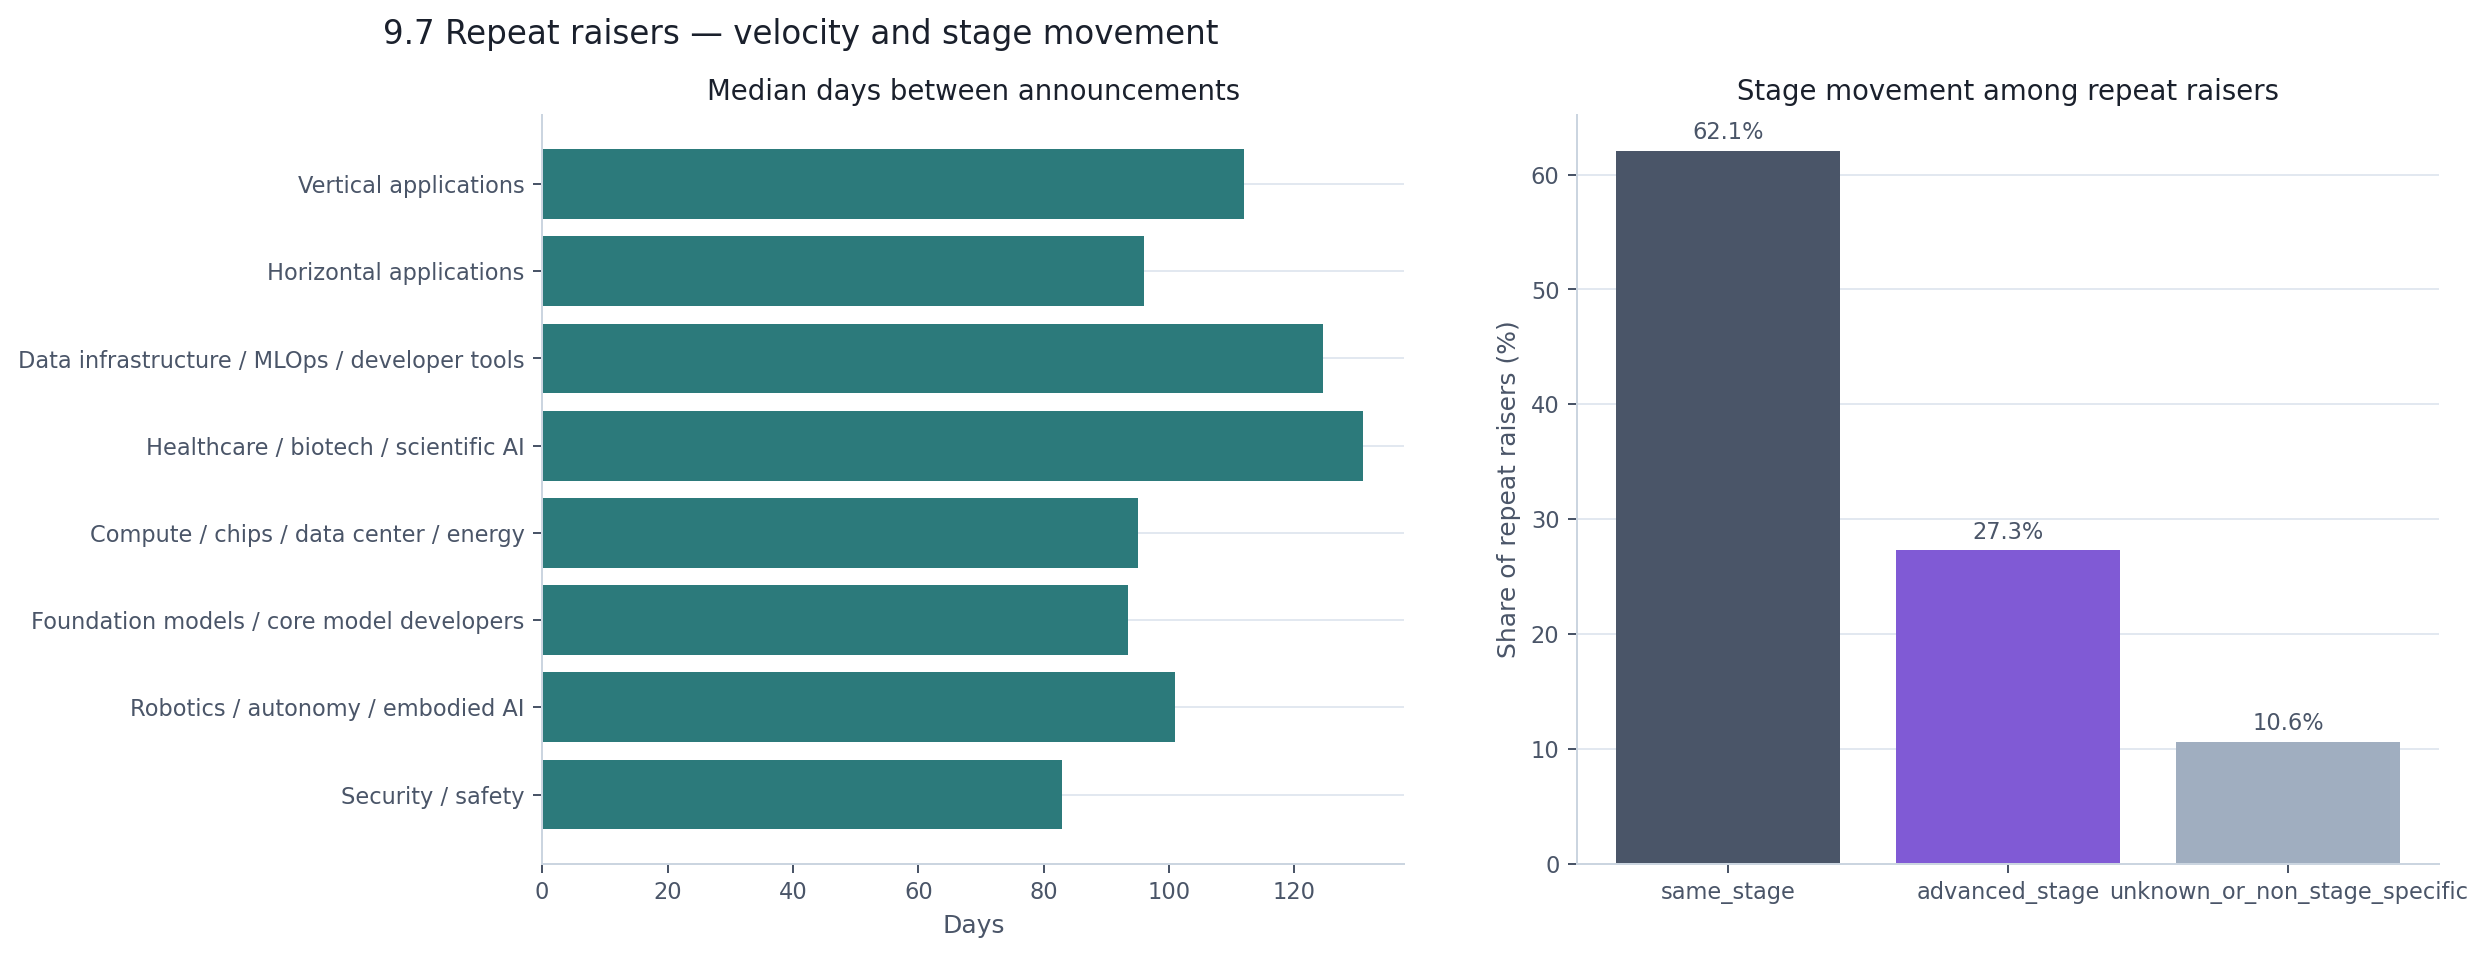
Most repeat fundraising is not companies graduating from one stage to the next. It is companies raising again at the same stage — extending runways, topping up rounds, or closing follow-on tranches. The venture ladder, in the data at least, is more of a landing than a staircase.
Repeat fundraising is one of the main mechanisms through which the market's capital becomes concentrated. It is not the only mechanism — mega rounds, financing-regime mix, and the inherent capital intensity of infrastructure all contribute. But it is the most visible one at the company level.
The market has 7,118 organizations. Most of them raised once, at a modest scale, in the early stages. That is genuine ecosystem breadth. But 82% of the disclosed capital went to 857 companies that came back to the market at least twice. The broad market and the capital-heavy market overlap only slightly. Repeat fundraising is where you can see the seam between them most clearly.
This dataset is strong enough for market-structure analysis. It is less useful for questions that depend on complete dollar disclosure or valuation coverage.
Country is known for 95% of rounds. Round amounts are disclosed for 73%. Valuation is known for just 11%. That means the report's strongest findings are about shape — concentration, geography, stage mix, and the infrastructure-versus-applications split — while every dollar total should be read as a disclosed lower bound.
The main limits are straightforward:
The previous chapters each examined one dimension of the market — capital type, company category, stage, geography, concentration, repeat fundraising, disclosure. This chapter asks a different question: when you lay all of those dimensions on top of each other, which patterns keep showing up no matter how you look?
Three do.
Section 5 showed the infrastructure-versus-applications split in detail. The chart below measures it differently — as a single gap for each AI stack category between its share of organizations and its share of disclosed dollars. Bars to the left mean "more companies than capital." Bars to the right mean "more capital than companies."
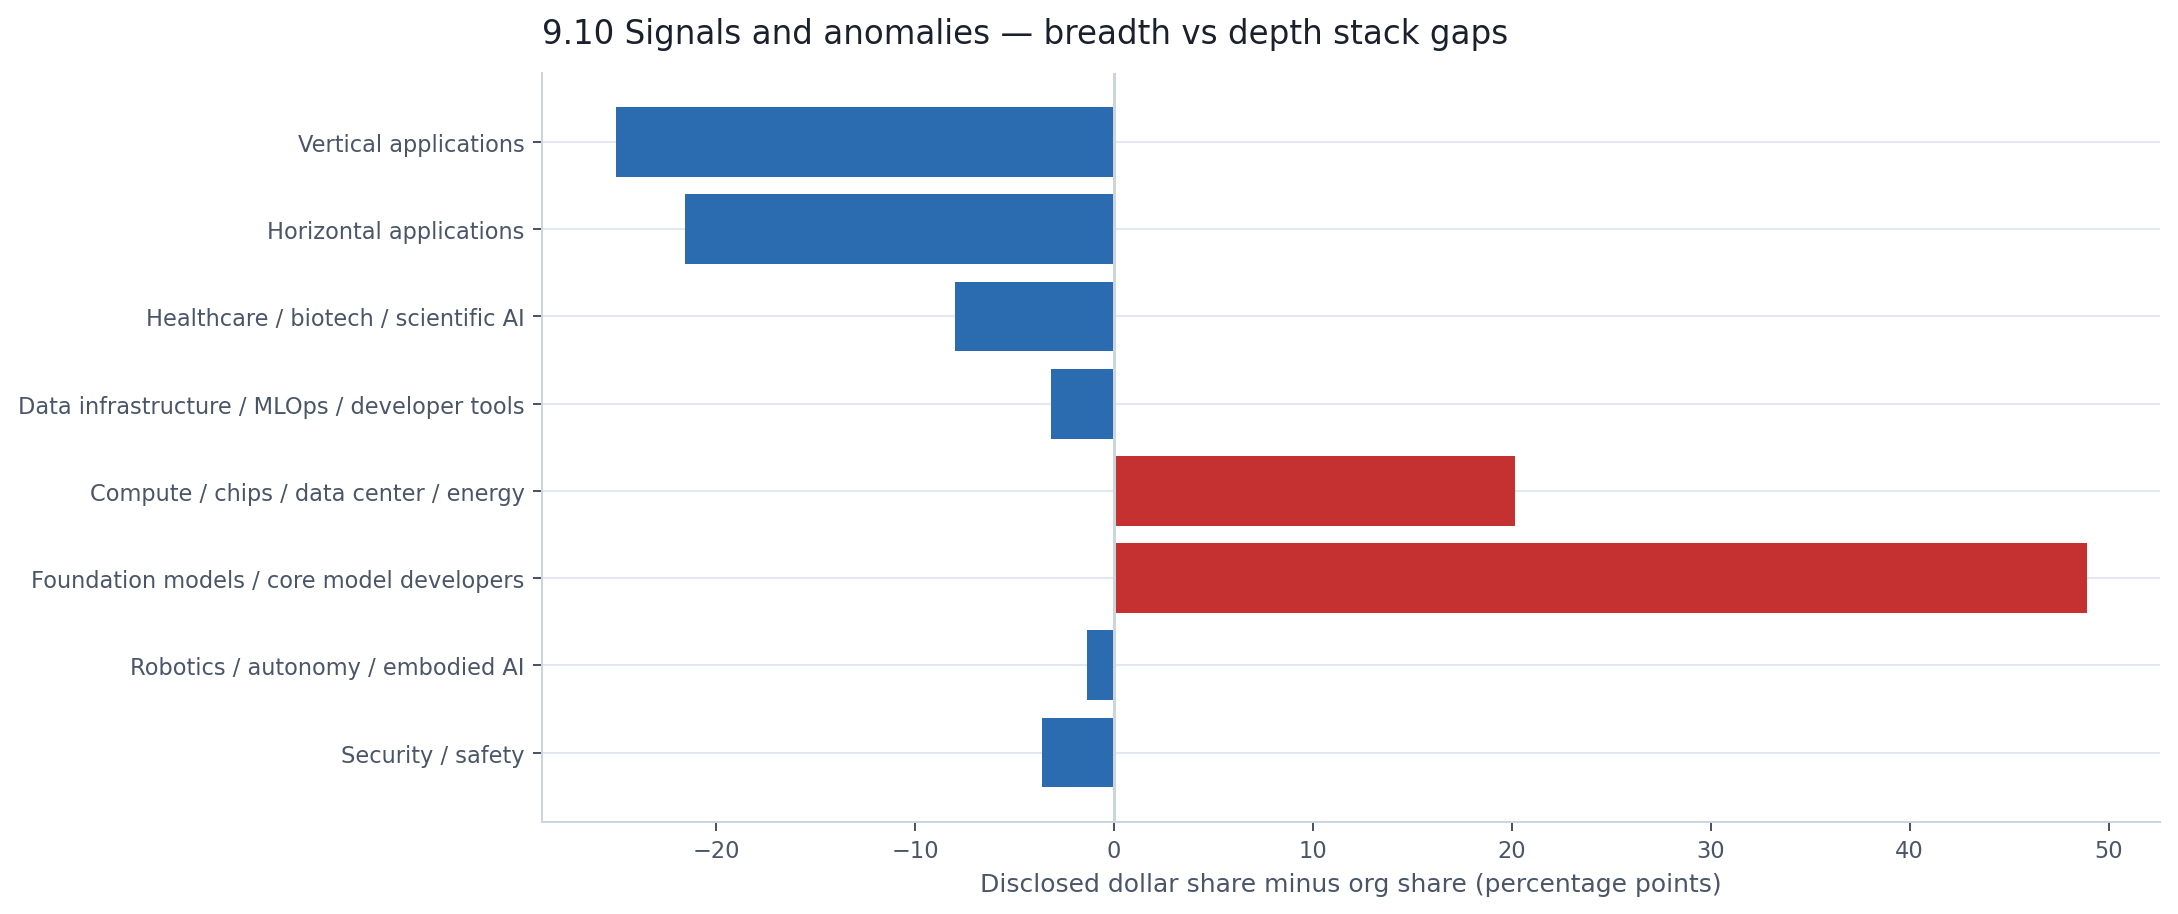
The two longest bars point in opposite directions. Vertical and horizontal applications sit 25 and 22 percentage points to the left — thousands of real companies that collectively account for less capital than a single foundation-model developer's annual fundraising. Foundation models sit 49 points to the right. Everything else clusters near the center line.
This chart is the cleanest expression of the underlying structure: one market is wide, the other is deep, and they barely overlap.
There is one more pattern worth making explicit, even though it has been visible since the concentration chapter. The market's different structural stories — concentration, repeat fundraising, mega rounds, infrastructure dominance, geographic gravity — are not independent findings. They are the same finding.
OpenAI appears in the top-10 by disclosed capital, in the repeat-raiser list, in the mega-round list, in the stage-outlier list, and in the foundation-model concentration table. Anthropic appears in all five. xAI appears in all five. CoreWeave appears in all five. Scale, Databricks, Crusoe, Firmus Technologies — the same names rotate through every analytical lens this report has applied.
That convergence is the market's deepest structural feature. It is not that AI financing is concentrated and repeat-heavy and infrastructure-dominated and geographically narrow. It is that all four of those descriptions point at the same small cluster of companies. Remove roughly 15–20 names from the dataset, and the headline dollar total drops by more than half. The monthly volatility disappears. The geographic concentration softens. The infrastructure-versus-applications split moderates. The repeat-raiser capital share drops dramatically.
The broad market — 7,000+ companies raising seed and pre-seed rounds across 90+ countries — would barely notice. It exists largely independent of those names. But the capital market that produces the headlines would be unrecognizable.
The visible AI financing market between April 2025 and April 2026 had genuine breadth — thousands of companies, dozens of countries, a steady rhythm of seed and early-stage activity that never paused. It also had extraordinary depth — hundreds of billions of dollars flowing into a small number of infrastructure and core-model companies that raised repeatedly, at enormous scale, in financing structures that often defy traditional venture labeling.
Those two markets coexist in the same dataset but barely interact. The broad market would exist without the capital-heavy one. The capital-heavy one would exist without the broad one. The fact that we call both of them "AI funding" is a linguistic convenience, not a structural description.
If this report leaves a reader with one mental model, it should be this: the AI financing landscape is not a pyramid with a wide base gradually tapering to a narrow peak. It is two separate layers — a wide, shallow pool and a narrow, very deep well — that happen to share a label.
This appendix exists because valuation data is too thin for a main chapter but too interesting to ignore entirely.
Only 11% of rounds in the dataset disclose a pre-money valuation. To say anything defensible, we constrain the analysis to a narrow subset: private-market, fresh-capital, equity-like rounds with both a known round amount and a disclosed pre-money valuation. No debt, no grants, no liquidity transactions, no public-market rounds. That leaves 775 rounds — 9.5% of the full dataset.
That is a small window. But it is an honest one, and the patterns inside it are sharp enough to be worth reporting.
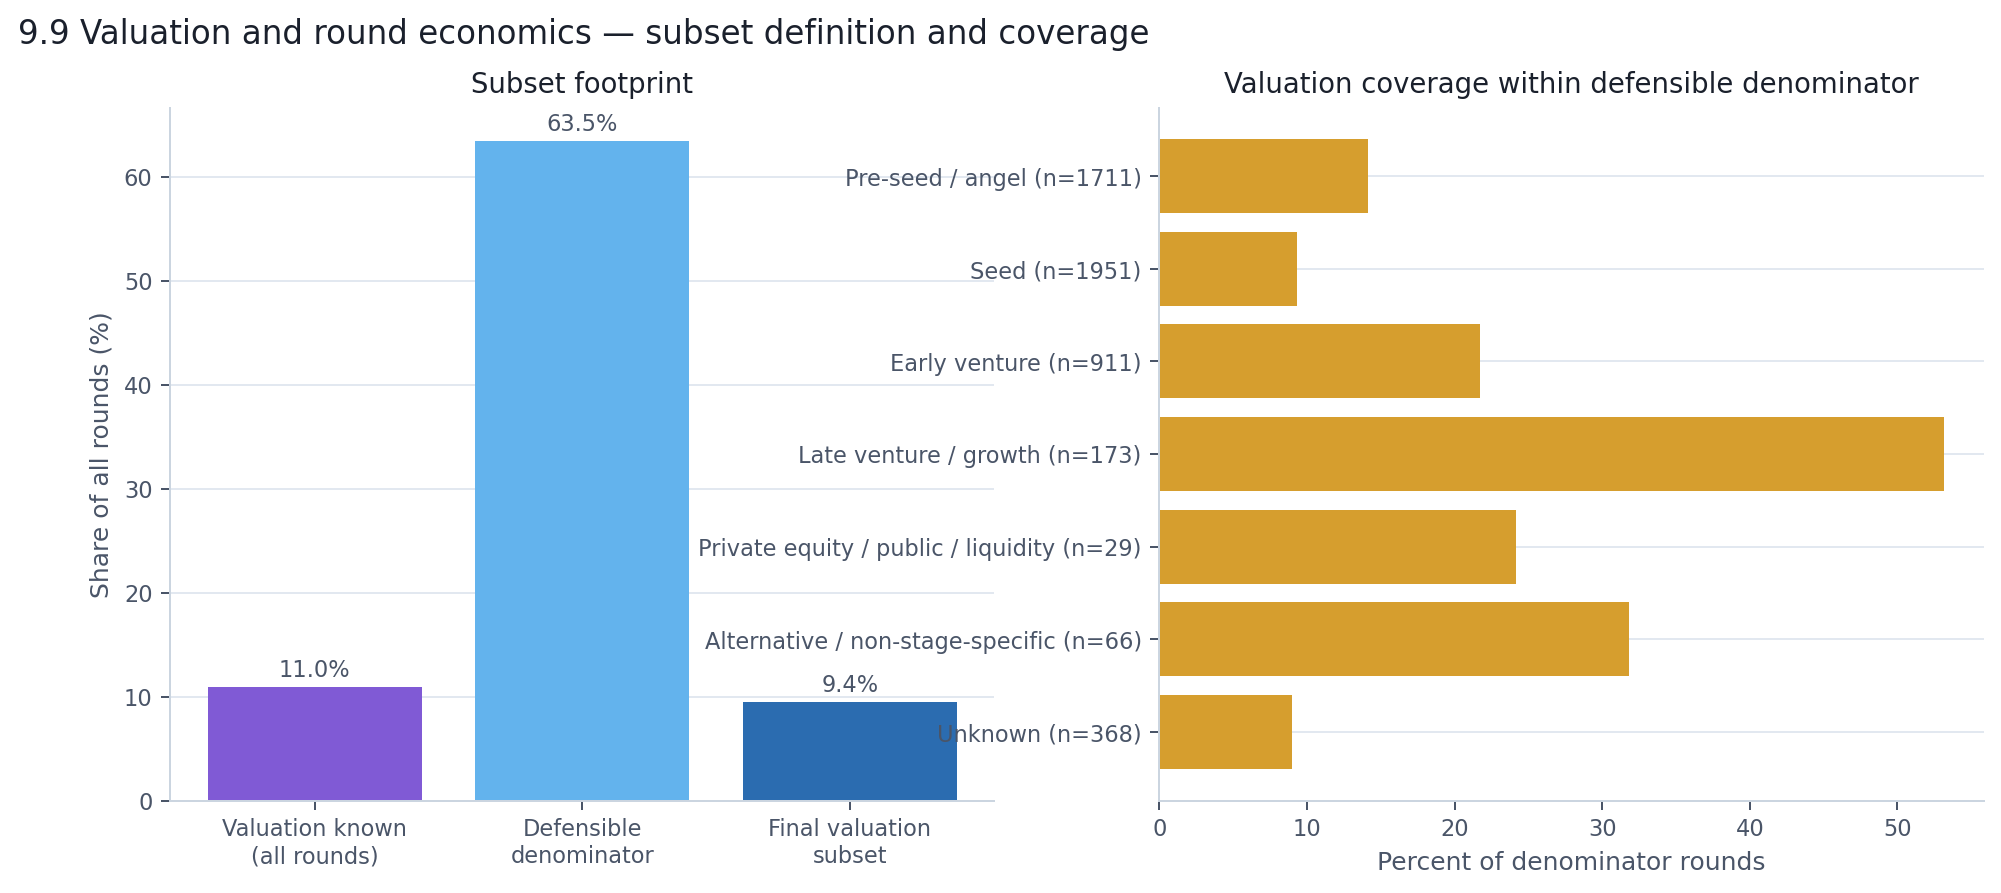
The right panel matters most. Late venture / growth rounds have valuation coverage of 53% — enough to work with. Early venture has 22%. Seed drops to 9%. Pre-seed is 14%. So later-stage valuation findings rest on a reasonable base. Earlier-stage findings should be read as directional, not definitive.
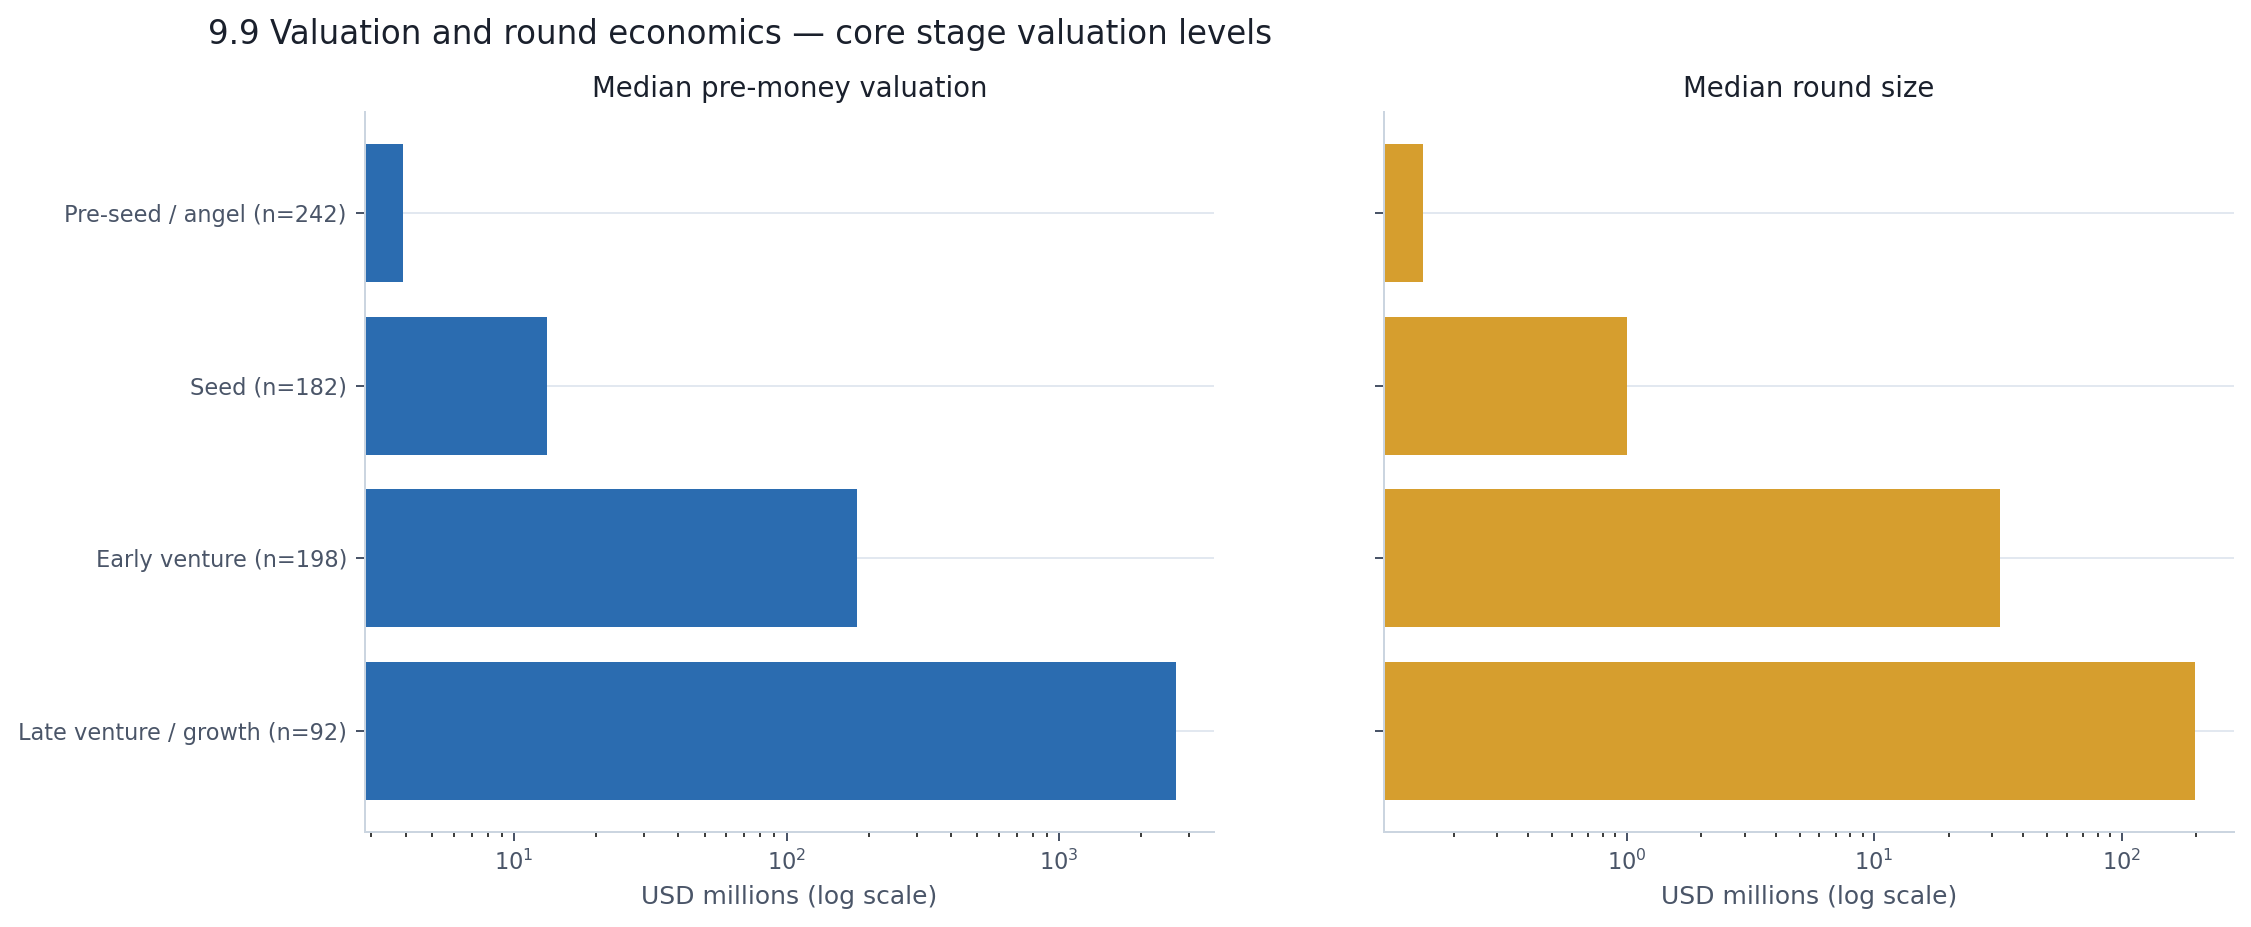
Within the subset, the stage ladder works the way you'd expect — only steeper than most people assume.
| Stage | Rounds in subset | Median pre-money valuation | Median round size |
|---|---|---|---|
| Pre-seed / angel | 242 | $3.9M | $0.15M |
| Seed | 182 | $13.2M | $1.0M |
| Early venture | 198 | $181.5M | $32.4M |
| Late venture / growth | 92 | $2.67B | $198.1M |
Pre-seed to seed is a 3.4× jump in median valuation. Seed to early venture is 13.7×. Early venture to late venture is 14.7×. From pre-seed to late venture/growth, the total span is roughly 680×. A company that enters the window at a $4 million pre-money and reaches late-stage territory is being priced at nearly 700 times its entry valuation. That is the full range of the visible AI venture ladder in twelve months of data.
The round-economics view asks a different question: not what are companies worth, but how much of themselves are they selling at each stage?
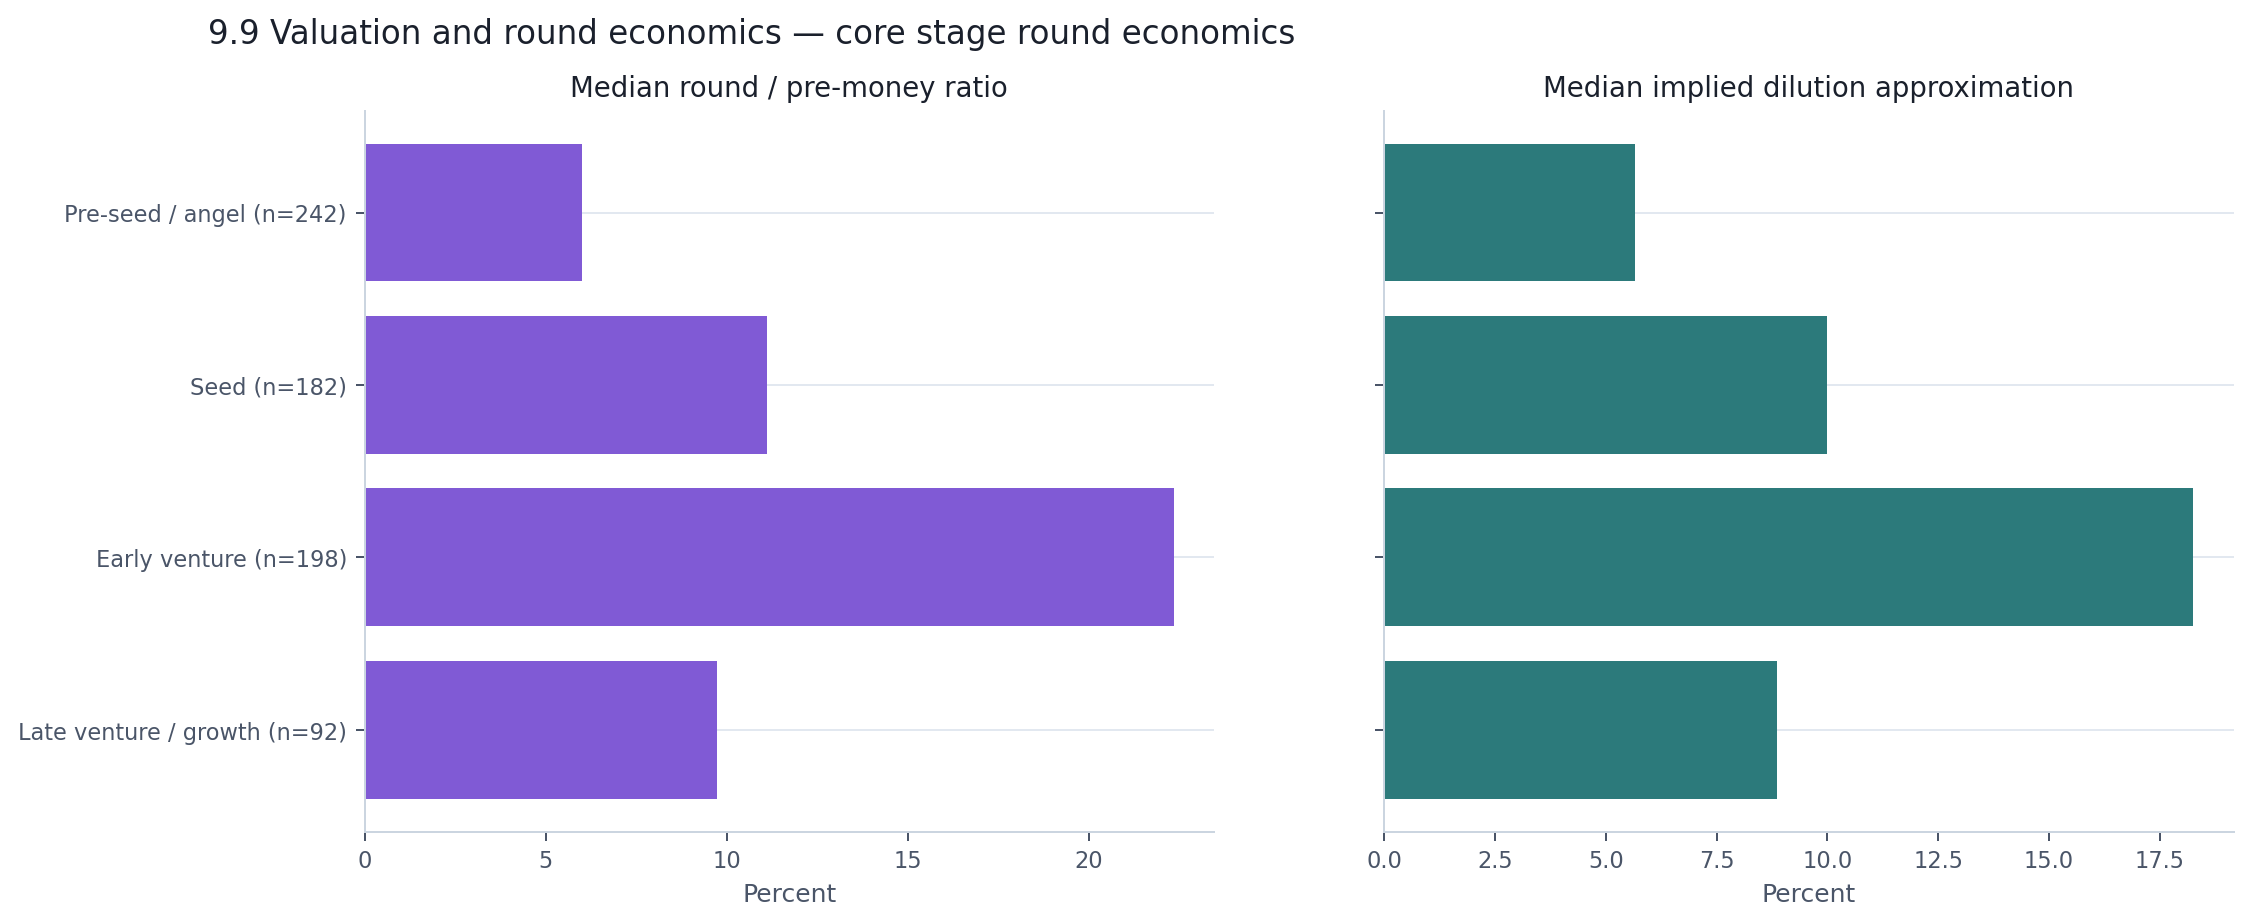
| Stage | Median round / pre-money | Median implied dilution |
|---|---|---|
| Pre-seed / angel | 6.0% | 5.7% |
| Seed | 11.1% | 10.0% |
| Early venture | 22.3% | 18.3% |
| Late venture / growth | 9.7% | 8.9% |
Early venture stands out. At a median round-to-pre-money ratio of 22.3%, these companies are raising a much larger fraction of their valuation in a single round than companies at any other stage. Late venture raises more in absolute dollars — $198 million versus $32 million — but against a much larger valuation base, so the proportional bite is smaller.
The 75th percentile for early venture is 69% round-to-pre-money, which means a meaningful share of early-venture rounds in the subset involve very aggressive raises relative to disclosed valuation. Those tails are precisely why this appendix uses medians, not averages.
The company-type split shows up here too, even inside this narrow subset.
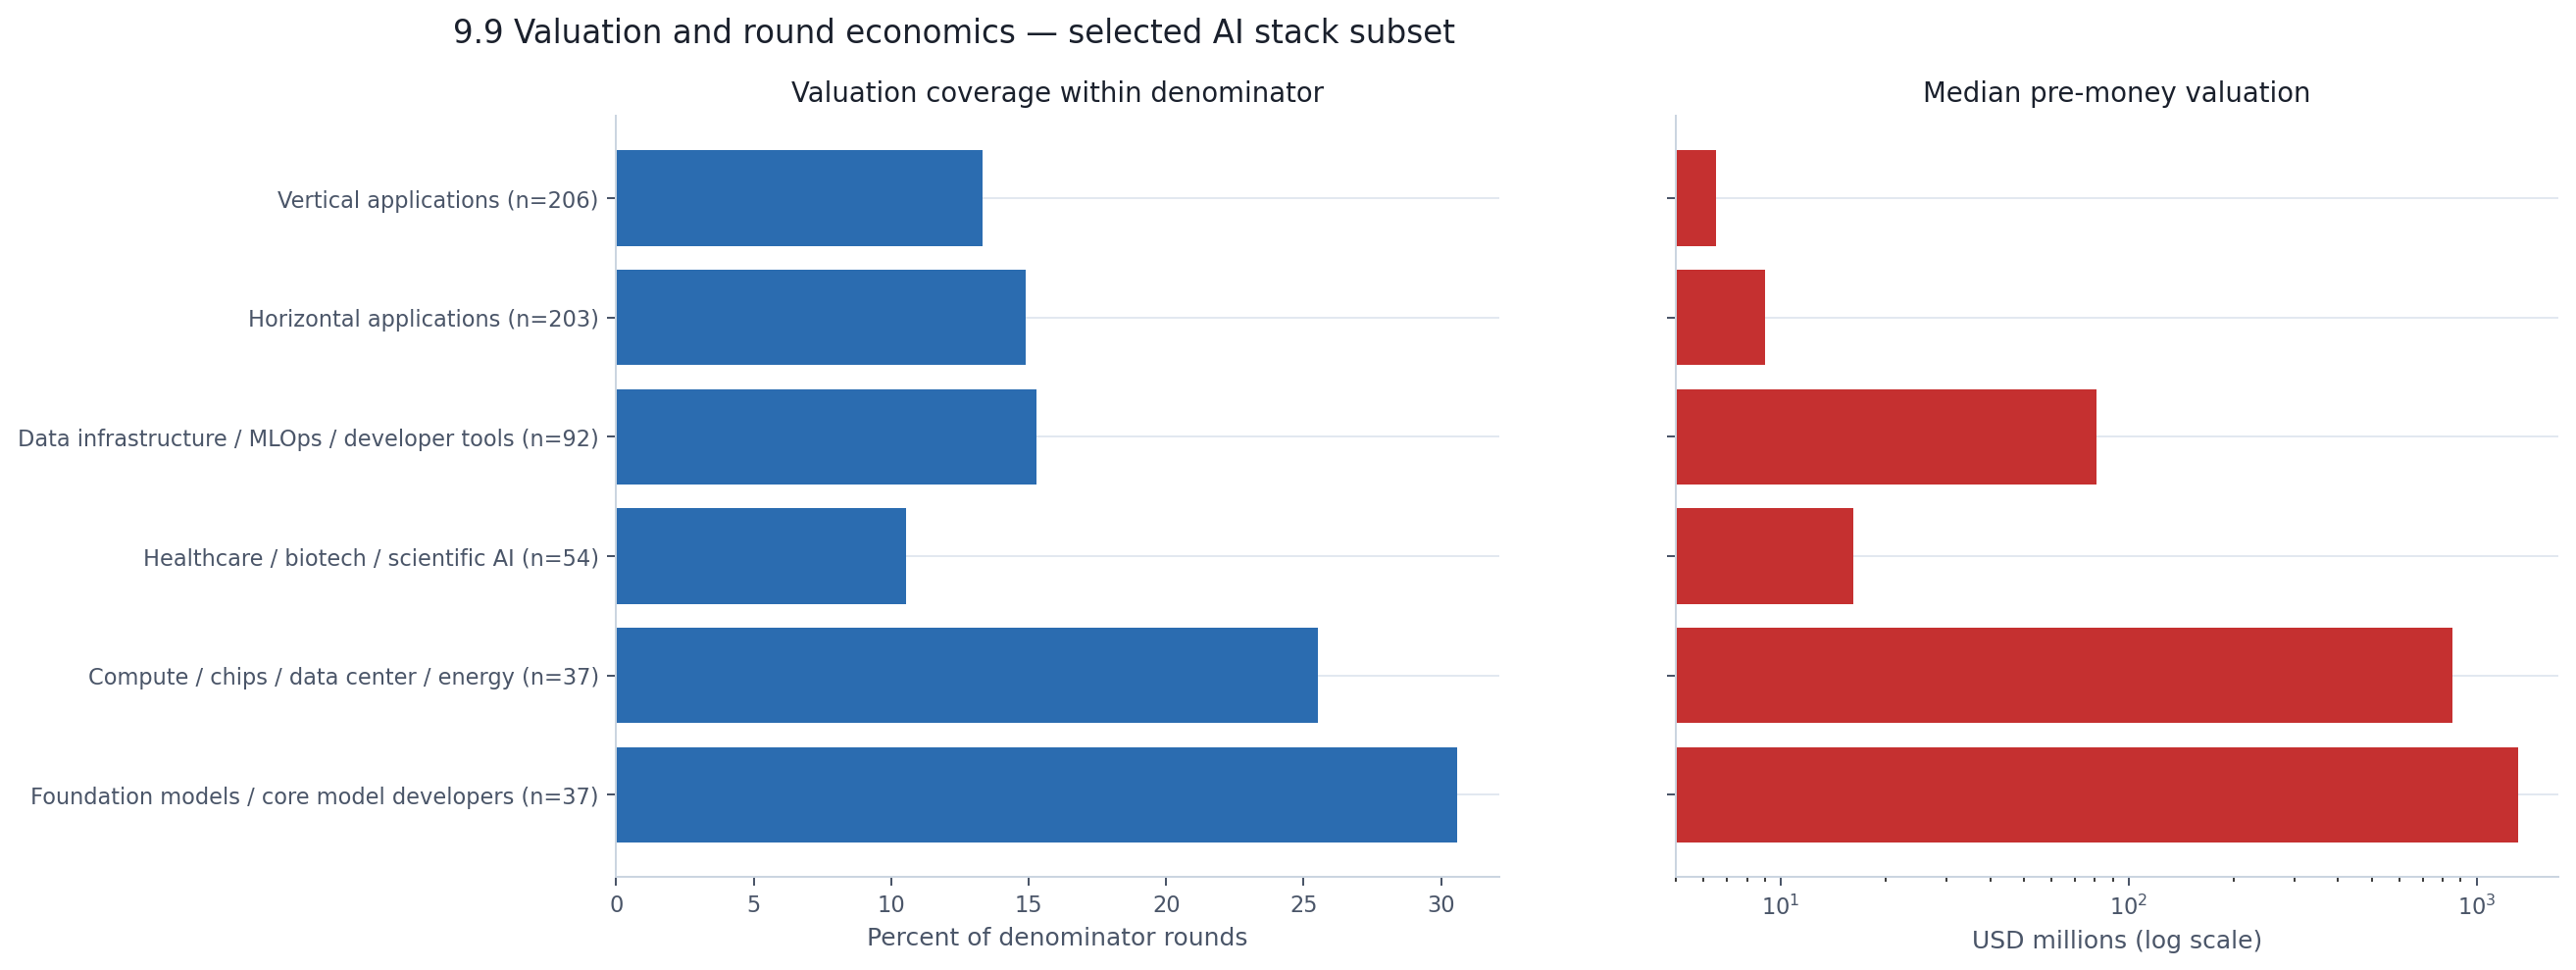
| AI stack category | Rounds in subset | Coverage within denominator | Median pre-money valuation |
|---|---|---|---|
| Foundation models | 37 | 30.6% | $1.32B |
| Compute / data center | 37 | 25.5% | $850M |
| Data infra / dev tools | 92 | 15.3% | $80.7M |
| Healthcare / biotech | 54 | 10.5% | $16.2M |
| Horizontal applications | 203 | 14.9% | $9.0M |
| Vertical applications | 206 | 13.3% | $6.5M |
Foundation model companies in the valuation subset carry a median pre-money of $1.32 billion. Vertical application companies carry $6.5 million. That is a 200× gap. Even within a constrained, disclosure-selected subset, the infrastructure-vs-applications divide that defined the main report shows up just as starkly in how these companies are priced.
The coverage column provides its own signal. Foundation models and compute have the highest valuation coverage within their defensible denominators — 31% and 26% respectively. Application categories sit around 13–15%. Infrastructure companies are not just valued higher; they are more likely to disclose that valuation. The valuation data we can see is disproportionately drawn from the capital-heavy end of the market.